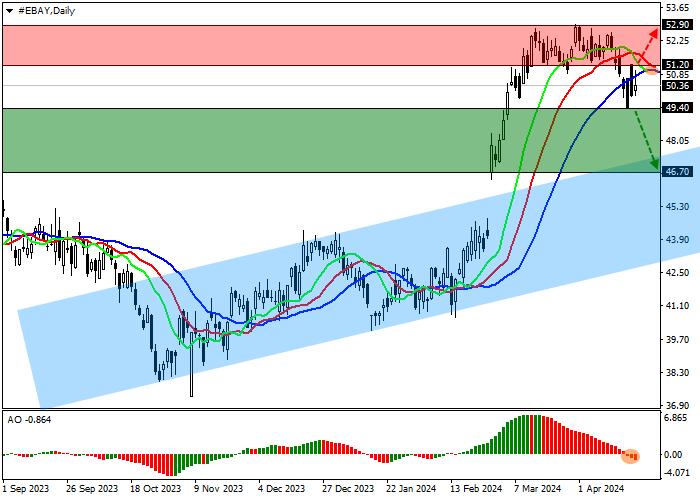
Shares of eBay Inc., an American online retail company, are trading at 50.00.
On the daily chart, the price is forming a downward correction, approaching the resistance line of the ascending channel 47.00–43.00.
On the four-hour chart, the quotes are trying to form a full-fledged downward trend with overcoming 47.00 and returning to the range. If it consolidates below the resistance line of 48.00, the next target will be 42.00.
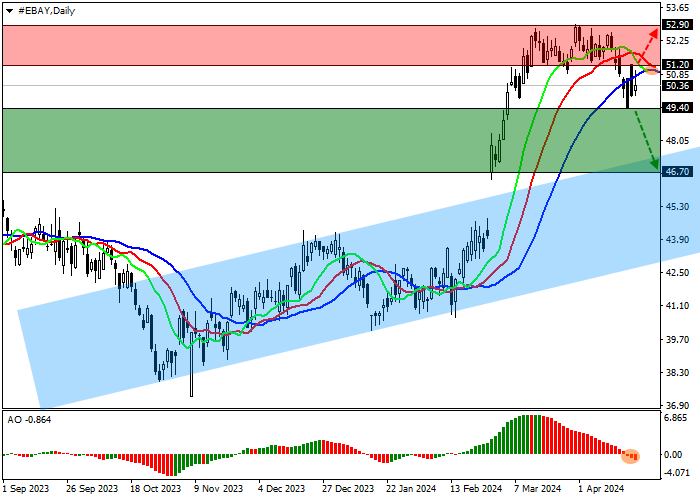
Technical indicators are in a state of uncertainty and are ready to issue a sell signal: fast EMA on the Alligator indicator have almost reached the signal line, and the AO histogram is forming downward bars in the sales zone.
Trading tips
Short positions may be opened after the consolidation below 49.40, with the target at 46.70. Stop loss is above the current price of 50.60. Implementation period: 7 days or more.
Long positions may be opened after the price rises and consolidates above 51.20, with the target at 52.90 and stop loss 50.50.