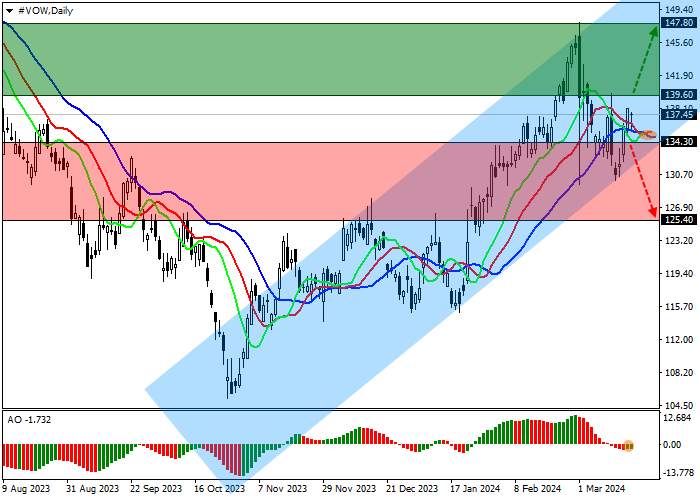
Shares of Volkswagen AG, a German automobile corporation, are moving within an intensifying correction, trading just below the level of 138.00.
On the daily chart, the price moves within the ascending channel with dynamic boundaries of 147.00–130.00, trying to retreat from the support line.
On the four-hour chart, after the reversal at the support line of 130.70, the quotes are rising and can form a Head and shoulders pattern with the Neckline at 139.00. However, if the support line is brokenercome, a decline to the low of March 14 at 130.00 is expected.
Technical indicators have given a buy signal: fast EMA of the Alligator indicator are above the signal line, keeping the fluctuation range wide, and the AO histogram is forming ascending bars in the sell zone, approaching the transition level.
Trading tips
Long positions may be opened after the price rises and consolidates above 139.60, with the target at 147.80 and stop loss 136.00. Implementation period: 7 days or more.
Short positions may be opened after the price declines and consolidates below 134.30, with the target at 125.40. Stop loss – 140.00.


اترك رسالتك الآن