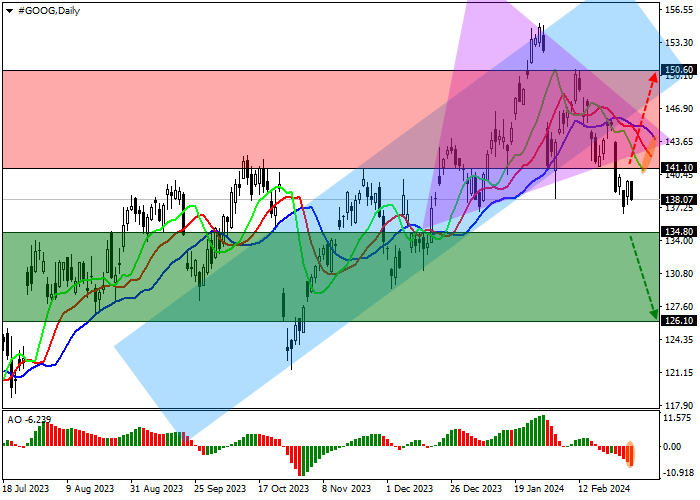
Shares of Alphabet Inc., an American holding, are trading in a global corrective trend at 138.00.
On the daily chart, a global upward trend is forming, within which the price has left the local channel with dynamic boundaries of 153.00–141.00 and is declining to last year’s lows.
On the four-hour chart, the quotes develop a Head and shoulders reversal pattern with the Neckline around 141.00. After full implementation of the formation, the price may fall to the support level of 125.00, and in case of a reversal and return to the ascending channel, it may reach the year's high of 155.00.
Technical indicators are ready to strengthen the sell signal: fast EMA on the Alligator indicator are moving away from the signal line, and the AO histogram is forming corrective bars below the transition level.

Trading tips
Short positions may be opened after the price declines and consolidates below 134.80, with the target at 126.10. Stop loss – 137.00. Implementation period: 7 days or more.
Long positions may be opened after the price rises and consolidates above 141.10, with the target at 150.60. Stop loss – 139.00.

اترك رسالتك الآن