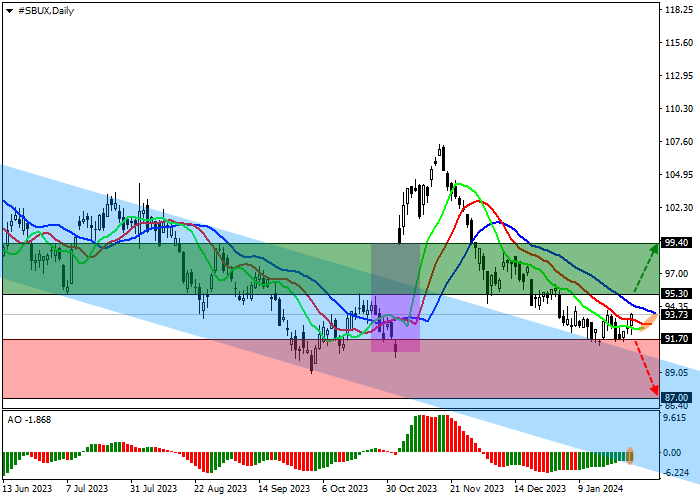
Shares of Starbucks Corp., one of the largest companies that owns the coffee shop chain of the same name, are moving in a corrective trend at 94.00.
On the daily chart, the price is held near the upper border of the channel 92.00–82.00 as part of its reverse testing.
On the four-hour chart, the downward correction is a development of the recent price gap of 100.00–91.00, which is now completely closed: after consolidating above the local high of 95.00, the quotes may reverse and begin to grow.
Technical indicators are weakening the sell signal: fast EMAs on the Alligator indicator are approaching the signal line, narrowing the range of fluctuations, and the AO histogram is forming ascending bars in the sell zone.
Trading tips
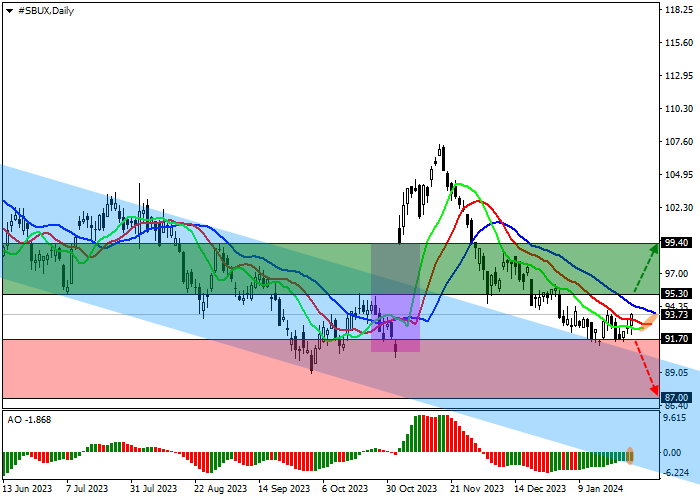
Long positions may be opened after the price rises and consolidates above 95.30 with the target at 99.40. Stop loss – 94.00. Implementation period: 7 days or more.
Short positions may be opened after the price declines and consolidates below 91.70 with the target at 87.00. Stop loss – 93.00.