Current trend
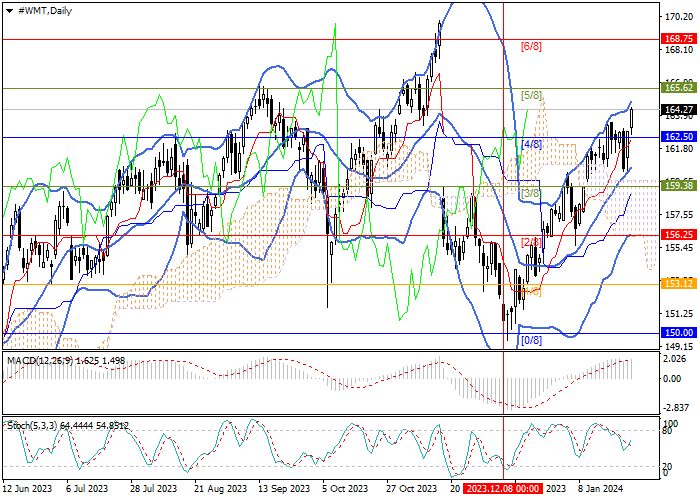
At the beginning of last month, shares of Walmart Inc., an American company that operates the world’s largest wholesale and retail chain, resumed growth as part of a long-term upward trend: the price reversed from the lower limit of the main Murrey trading range of 150.00 (Murrey level [0/8]) and consolidated above its central mark of 162.50 (Murrey Level [4/8]), which allows it to reach the reversal level of 168.75 (Murrey Level [6/8]). The key “bearish” level is 159.38 (Murrey level [3/8]), below the middle line of Bollinger bands, after consolidation below which, the decline will resume around 156.25 (Murrey level [2/8], the lower line of Bollinger bands) and 153.12 (Murrey level [1/8]), which is less likely.
Technical indicators reflect a continuation of the upward trend: Bollinger Bands and Stochastic are directed upward, and the MACD histogram is increasing in the positive zone.
Support and resistance
Resistance levels: 165.62, 168.75.
Support levels: 159.38, 156.25, 153.12.
Trading tips
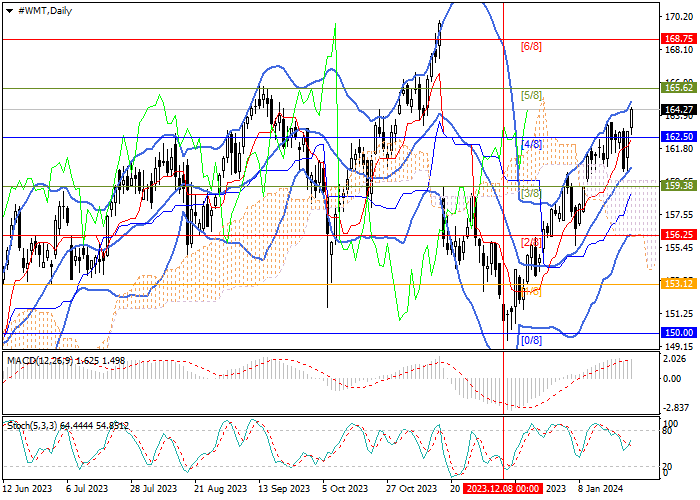
Long positions may be opened from 164.50 with the target at 168.75 and stop loss around 162.40. Implementation time: 5–7 days.
Short positions may be opened below 159.38 with the targets at 156.25, 153.12 and stop loss 161.30.