


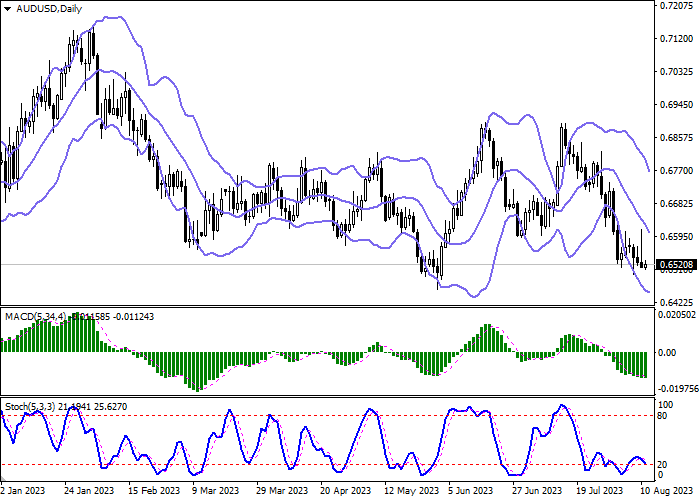
| Scenario | |
|---|---|
| Timeframe | Intraday |
| Recommendation | SELL STOP |
| Entry Point | 0.6495 |
| Take Profit | 0.6400 |
| Stop Loss | 0.6550 |
| Key Levels | 0.6345, 0.6400, 0.6450, 0.6495, 0.6550, 0.6594, 0.6622, 0.6661 |
| Alternative scenario | |
|---|---|
| Recommendation | BUY STOP |
| Entry Point | 0.6550 |
| Take Profit | 0.6661 |
| Stop Loss | 0.6495 |
| Key Levels | 0.6345, 0.6400, 0.6450, 0.6495, 0.6550, 0.6594, 0.6622, 0.6661 |
Current trend
The Australian dollar shows mixed trading dynamics in the AUD/USD pair during the Asian session, holding near 0.6515 and local lows from August 8. The instrument has been developing a "bearish" trend throughout the current week, despite the not very strong positions of the US currency, which was under pressure from consumer inflation statistics the day before.
The annual rate for July was revised upward from 3.0% to 3.2%, below analysts' forecasts of 3.3%, while monthly rates, as expected, remained at the same level of 0.2%. In turn, the Core CPI corrected from 4.8% to 4.7%, while the experts did not count on changes at all. Thus, the dynamics accelerated; however, given that the inflation decline was very significant in June, the current correction should be attributed to seasonal phenomena, and therefore it is not worth expecting a change in the rhetoric of the US Federal Reserve regarding further steps in monetary policy.
Pressure on the position of the Australian dollar the day before was exerted by forecasts for Consumer Inflation Expectations in Australia for the next 12 months from the Melbourne Institute. The August figure was revised down from 5.2% to 4.9% on an annualized basis, which is likely to have a softening effect on the further rhetoric of the Reserve Bank of Australia (RBA). Earlier, the national currency was actively losing value, reacting to the publication of weak statistics on inflation from China: on an annualized basis, the Consumer Price Index fell from 0.0% to -0.3%, while analysts projected -0.4%, and the Producer Price Index adjusted from -5.4% to -4.4%. Deflationary phenomena are observed in the economy, and the growth momentum is actively weakening, which in the future may lead to a decrease in exports and increased pressure on the Australian economy.
Support and resistance
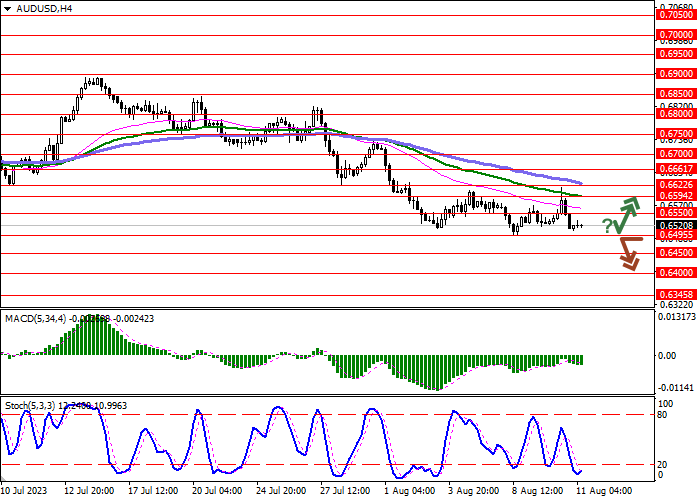
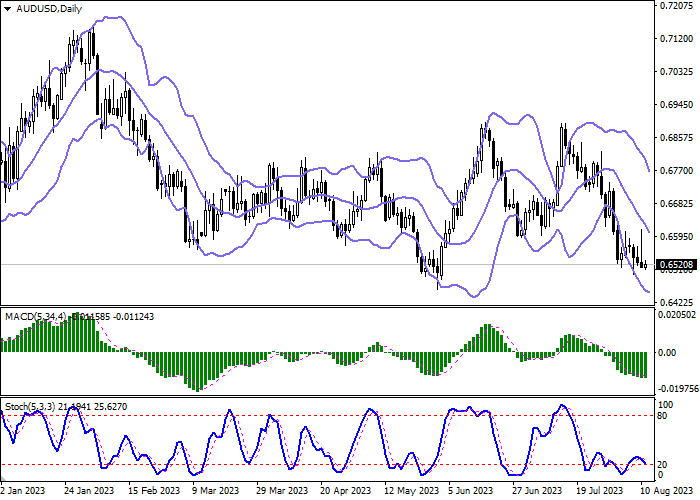
On the daily chart, Bollinger Bands are steadily declining. The price range is narrowing, reflecting ambiguous dynamics of trading in the short term. MACD maintains a relatively strong sell signal, lying below the signal line. Stochastic, which reversed downwards this week, again approached its lows, indicating the risks of oversold Australian dollar in the ultra-short term.
Resistance levels: 0.6550, 0.6594, 0.6622, 0.6661.
Support levels: 0.6495, 0.6450, 0.6400, 0.6345.
Trading tips
Short positions may be opened after a breakdown of 0.6495 with the target at 0.6400. Stop-loss — 0.6550. Implementation time: 1-2 days.
A rebound from 0.6495 followed by a breakout of 0.6550 may become a signal for opening long positions with the target at 0.6661. Stop-loss — 0.6495.
إخلاء المسؤولية: الآراء الواردة هنا تعبر فقط عن رأي الكاتب، ولا تمثل الموقف الرسمي لـ Followme. لا تتحمل Followme مسؤولية دقة أو اكتمال أو موثوقية المعلومات المُقدمة، ولا تتحمل مسؤولية أي إجراءات تُتخذ بناءً على المحتوى، ما لم يُنص على ذلك صراحةً كتابيًا.

