


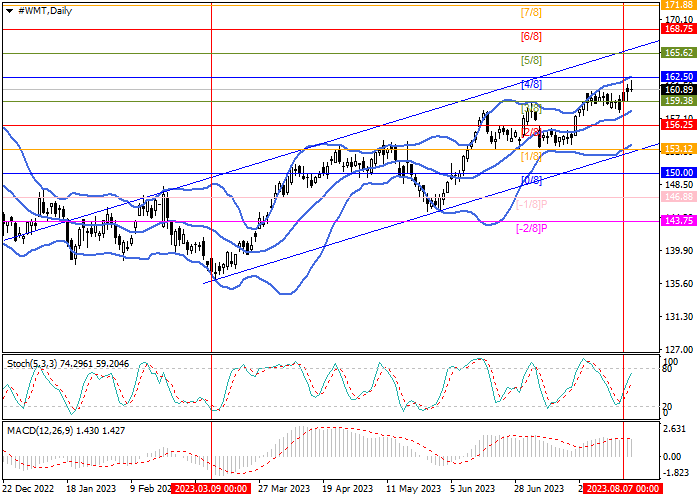
| Scenario | |
|---|---|
| Timeframe | Weekly |
| Recommendation | BUY STOP |
| Entry Point | 162.50 |
| Take Profit | 168.75, 171.88 |
| Stop Loss | 160.30 |
| Key Levels | 150.00, 153.12, 156.25, 162.50, 168.75, 171.88 |
| Alternative scenario | |
|---|---|
| Recommendation | SELL STOP |
| Entry Point | 156.25 |
| Take Profit | 153.12, 150.00 |
| Stop Loss | 158.40 |
| Key Levels | 150.00, 153.12, 156.25, 162.50, 168.75, 171.88 |
Current trend
Shares of Walmart Inc., an American company that manages the world's largest wholesale and retail chain, are actively rising as part of a long-term upward trend.
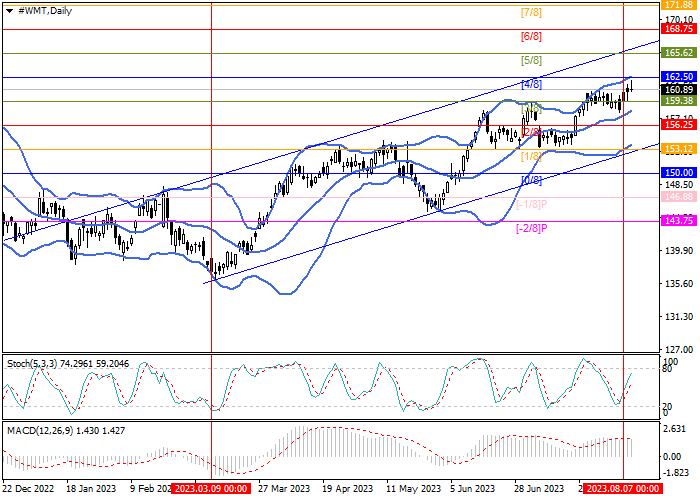
Currently, the price is close to the central mark of the main Murray trading range of 162.50 (Murray level [4/8]), the breakout of which will allow the instrument to strengthen its positions to the levels of 168.75 (Murray level [6/8]) and 171.88 (Murray level [7/8]). The key for the "bears" is the reversal level of 156.25 (Murray level [2/8]), below the middle line of the Bollinger Bands, the breakdown of which will act as a catalyst for strengthening the downward dynamics to the area of 153.12 (Murray level [1/8]) and 150.00 (Murray level [0/8]).
Technical indicators point out the continuation of the upward trend: the Bollinger Bands and the Stochastic are directed upwards, the MACD histogram is stable in the positive zone.
Support and resistance
Resistance levels: 162.50, 168.75, 171.88.
Support levels: 156.25, 153.12, 150.00.
Trading tips
Long positions should be opened above 162.50 with targets at 168.75, 171.88 and stop-loss at 160.30. Implementation period: 5-7 days.
Short positions may be opened below 156.25 with targets at 153.12, 150.00 and stop-loss at 158.40.
إخلاء المسؤولية: الآراء الواردة هنا تعبر فقط عن رأي الكاتب، ولا تمثل الموقف الرسمي لـ Followme. لا تتحمل Followme مسؤولية دقة أو اكتمال أو موثوقية المعلومات المُقدمة، ولا تتحمل مسؤولية أي إجراءات تُتخذ بناءً على المحتوى، ما لم يُنص على ذلك صراحةً كتابيًا.

