


| Scenario | |
|---|---|
| Timeframe | Weekly |
| Recommendation | SELL |
| Entry Point | 23.17 |
| Take Profit | 21.76, 20.78 |
| Stop Loss | 23.75 |
| Key Levels | 20.78, 21.76, 24.82, 26.10, 28.00 |
| Alternative scenario | |
|---|---|
| Recommendation | BUY STOP |
| Entry Point | 24.85 |
| Take Profit | 26.10, 28.00 |
| Stop Loss | 24.25 |
| Key Levels | 20.78, 21.76, 24.82, 26.10, 28.00 |
The pair is in correction; the probability of fall is maintained.
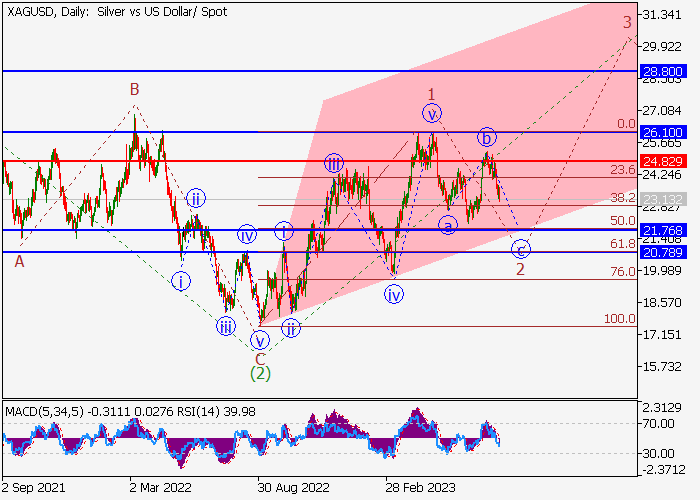
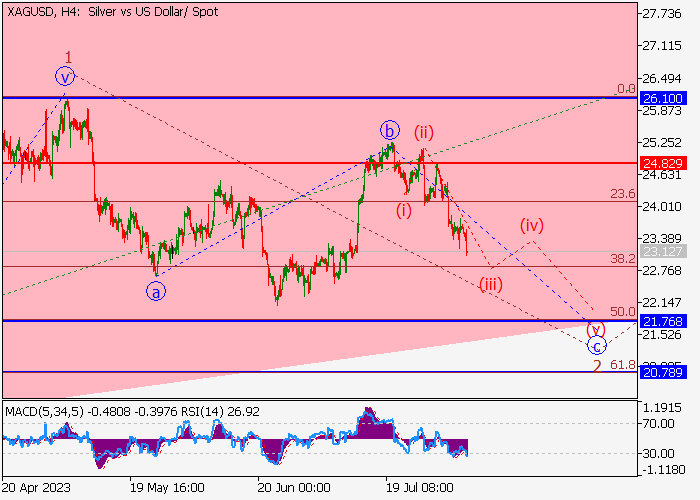
On the daily chart, the downward correction of the higher level has completed as the second wave (2) and the third wave (3) is being built, in which the entry first wave of the lower level 1 of (3) has appeared and a local correction is observed as the second wave 2 of (3). At the moment, there is a construction of a descending wave c of 2, within which wave (iii) of 2 is developing. If the assumption is correct, then the downward dynamics in the XAG/USD pair will continue to the area of 21.76–20.78. The level of 24.82 is critical and stop-loss for this scenario.
Main scenario
Short positions are relevant below the level of 24.82 with targets at 21.76–20.78. Implementation time: 7 days and more.
Alternative scenario
Breakout and consolidation of the price above 24.82 will allow the instrument to continue its uptrend to the area of 26.10–28.00.
إخلاء المسؤولية: الآراء الواردة هنا تعبر فقط عن رأي الكاتب، ولا تمثل الموقف الرسمي لـ Followme. لا تتحمل Followme مسؤولية دقة أو اكتمال أو موثوقية المعلومات المُقدمة، ولا تتحمل مسؤولية أي إجراءات تُتخذ بناءً على المحتوى، ما لم يُنص على ذلك صراحةً كتابيًا.

