Current trend
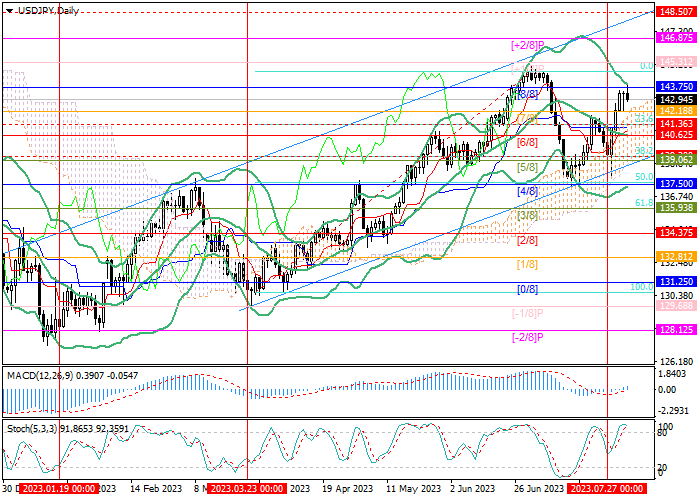
The USD/JPY pair is moving within a long-term upward channel. Last week, the price tested its lower border around 138.40 but could not consolidate below it and resumed growth.
Currently, the quotes are testing 143.75 (Murrey level [8/8]), which breakout allows them to reach 145.31 (Murrey level [ 1/8]) and 146.87 (Murrey level [ 2/8]) and 148.50 (the upper limit of the ascending channel). The key “bearish” level is 140.62 (Murrey level [6/8]), supported by the middle line of Bollinger bands. After its breakdown, the decline may continue to 137.50 (Murrey level [4/8], Fibonacci correction 50.0%) and 135.93 (Murrey level [3/8], Fibonacci retracement 61.8%).
Technical indicators do not give a single signal: Bollinger bands are directed downwards, Stochastic has reached the overbought zone and may reverse downwards but the MACD histogram is increasing in the positive zone.
Support and resistance
Resistance levels: 143.75, 145.31, 146.87, 148.50.
Support levels: 140.62, 137.50, 135.93.
Trading tips
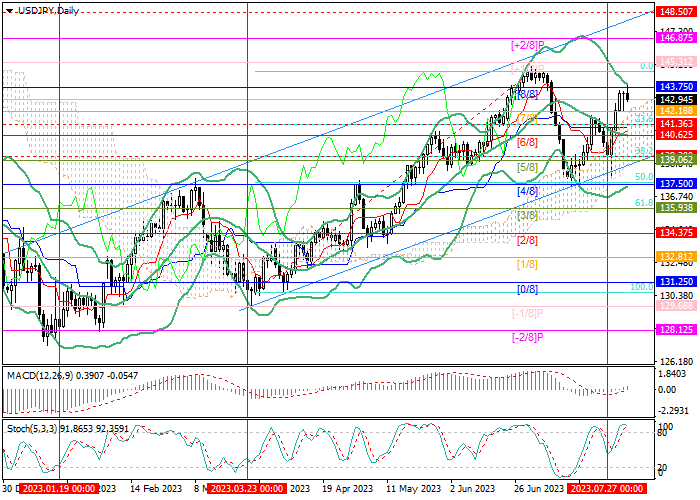
Long positions may be opened above 143.75 with the targets at 145.31, 146.87, 148.50, and stop loss around 142.60. Implementation period: 5–7 days.
Short positions may be opened below 140.62 with the targets at 137.50, 135.93, and stop loss around 142.00.