


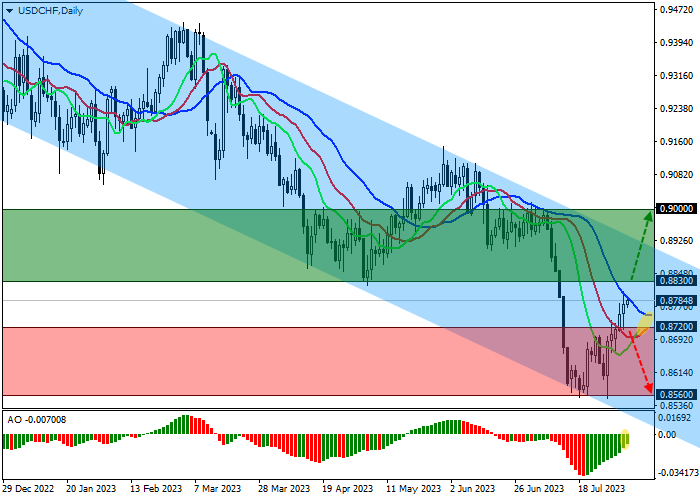
| Scenario | |
|---|---|
| Timeframe | Weekly |
| Recommendation | BUY STOP |
| Entry Point | 0.8835 |
| Take Profit | 0.9000 |
| Stop Loss | 0.8750 |
| Key Levels | 0.8560, 0.8720, 0.8830, 0.9000 |
| Alternative scenario | |
|---|---|
| Recommendation | SELL STOP |
| Entry Point | 0.8715 |
| Take Profit | 0.8560 |
| Stop Loss | 0.8820 |
| Key Levels | 0.8560, 0.8720, 0.8830, 0.9000 |
Current trend
The Swiss currency continues to lose ground against the US dollar on the back of its recovery. At the moment, the USD/CHF pair is trading in a corrective trend, at around 0.8785.
According to the data presented, the index of business activity of the leading sectors of Switzerland, calculated by procure.ch, fell in July from 44.9 points to 38.5 points, demonstrating the lowest value since the 2008 crisis. The indicator was affected by a significant decrease in turnover: the wholesale and retail trade sector lost 11.1% compared to the previous year, while the volume of operations in the transportation sector decreased by 6.4%. The biggest growth, as in previous months, was achieved by the tourism sector, which added 40.9%. In addition, according to the July consumer survey from the Swiss State Secretariat for Economic Affairs (SECO), economic growth expectations are -27.0 points, which is much worse than the annual average of -6.0 points.
In turn, the US dollar continues to rise smoothly, trading around 102.500 in the USD Index. Yesterday, Automatic Data Processing (ADP) released its July Nonfarm Payrolls report in the US, which showed a decline from 455.0 thousand to 324.0 thousand, well above the market-led estimate of 189.0 thousand. Today, data on Initial Jobless Claims will be published, where analysts suggest an increase from 221.0 thousand to 227.0 thousand.
Support and resistance
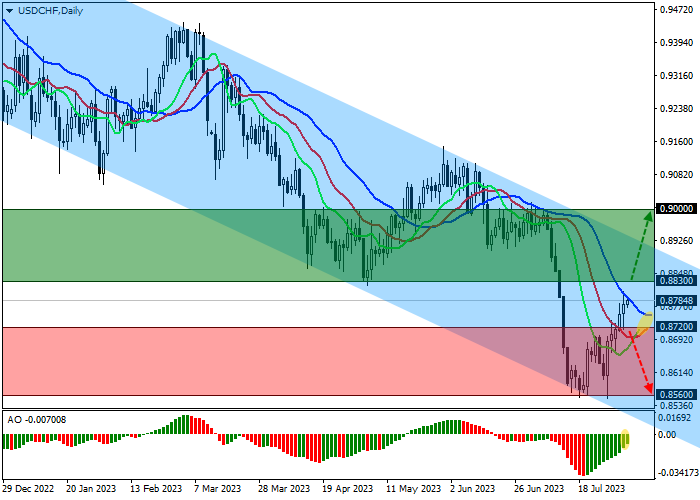
On the daily chart, the price is correcting, rising towards the resistance line of the global downward corridor with the boundaries of 0.8920-0.8450.
Technical indicators keep a sell signal, but hint at a quick local correction: fast EMAs on the Alligator indicator began to approach the signal line, and the AO histogram, being in the sell zone, is forming new upward bars.
Support levels: 0.8720, 0.8560.
Resistance levels: 0.8830, 0.9000.
إخلاء المسؤولية: الآراء الواردة هنا تعبر فقط عن رأي الكاتب، ولا تمثل الموقف الرسمي لـ Followme. لا تتحمل Followme مسؤولية دقة أو اكتمال أو موثوقية المعلومات المُقدمة، ولا تتحمل مسؤولية أي إجراءات تُتخذ بناءً على المحتوى، ما لم يُنص على ذلك صراحةً كتابيًا.

