
| Scenario | |
|---|---|
| Timeframe | Weekly |
| Recommendation | BUY STOP |
| Entry Point | 103.00 |
| Take Profit | 107.00 |
| Stop Loss | 100.00 |
| Key Levels | 95.00, 99.00, 101.00, 102.00, 103.00, 110.00, 119.00 |
| Alternative scenario | |
|---|---|
| Recommendation | SELL STOP |
| Entry Point | 99.00 |
| Take Profit | 95.60 |
| Stop Loss | 101.00 |
| Key Levels | 95.00, 99.00, 101.00, 102.00, 103.00, 110.00, 119.00 |
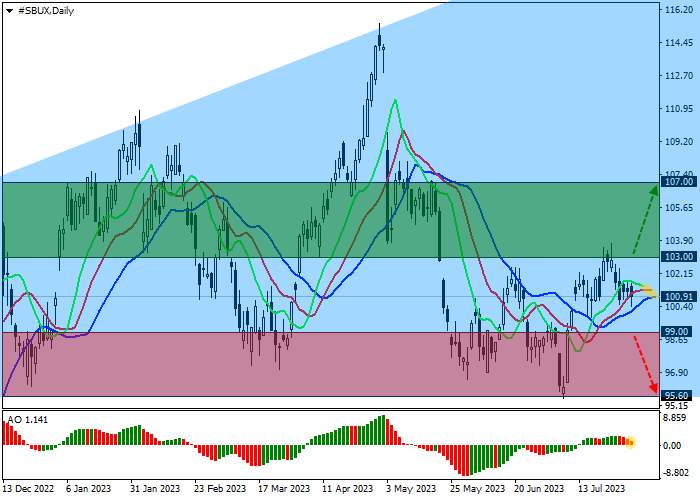
Shares of Starbucks Corp., one of the largest companies in the world, which owns the chain of coffee houses of the same name, are moving within a corrective trend at 101.00.
On the daily chart, the price is moving within the global Expanding formation pattern with dynamic boundaries of 119.00–95.00, starting a new wave of growth.
On the four-hour chart, after breaking the local high of June 16 at 102.00, the quotes corrected before continuing the upward movement to the current high of 103.00, in case of consolidation above which the global growth will continue to the resistance level of January 27 at 110.00.
Technical indicators reversed upwards: fast EMAs on the Alligator indicator are above the signal line, expanding the range of fluctuations, and the AO histogram is forming corrective bars in the buying zone.
Trading tips
Long positions may be opened after the price rises and consolidates above 103.00 with the target at 107.00. Stop loss – 100.00. Implementation period: 7 days or more.
Short positions may be opened after a reversal, reduction and consolidation of the price below 99.00 with the target at 95.60. Stop loss – 101.00.
إخلاء المسؤولية: الآراء الواردة هنا تعبر فقط عن رأي الكاتب، ولا تمثل الموقف الرسمي لـ Followme. لا تتحمل Followme مسؤولية دقة أو اكتمال أو موثوقية المعلومات المُقدمة، ولا تتحمل مسؤولية أي إجراءات تُتخذ بناءً على المحتوى، ما لم يُنص على ذلك صراحةً كتابيًا.

اترك رسالتك الآن