Key Highlights
- Gold price extended losses below the $1,650 support.
- A major bearish trend line is forming with resistance near $1,650 on the 4-hours chart.
- EUR/USD and GBP/USD might start a fresh downward move.
- USD/JPY could clear the last high at 145.90 and continue higher.
Gold Price Technical Analysis
Gold price remained in a bearish zone below the $1,688 resistance against the US Dollar. The price declined below the $1,665 support level to move into a bearish zone.
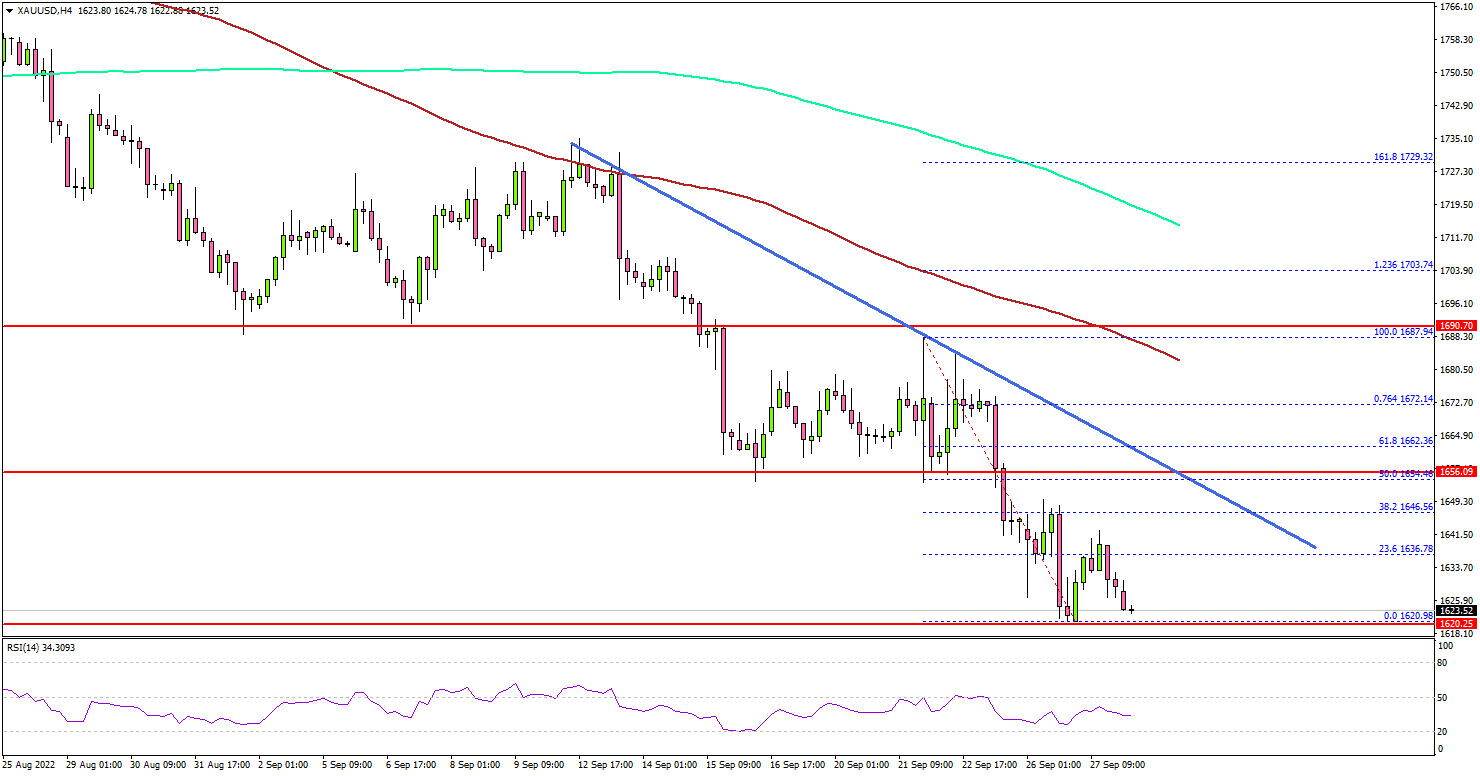
The 4-hours chart of XAU/USD indicates that the price extended losses below the $1,650 support, the 100 simple moving average (red, 4-hours), and the 200 simple moving average (green, 4-hours).
The price even spiked below the $1,625 level and traded as low as $1,620. It is now consolidating losses above the $1,620 level. On the upside, the price might face sellers near the $1,646 level. There is also a major bearish trend line forming with resistance near $1,650 on the same chart.
The next major resistance is near the $1,662 level. Any more gains might send the price towards the $1,688 resistance level.
On the downside, an initial support is near the $1,620 level. The next major support is near the $1,600 level, below which the price could accelerate lower. In the stated case, the price may perhaps decline towards the $1,580 level.
Looking at EUR/USD, the pair is facing resistance near the 0.9680 and 0.9700 levels. If the bears remain in action, the pair could decline below 0.9550.
Economic Releases to Watch Today
- US Pending Home Sales for August 2022 (YoY) – Forecast -1.4%, versus -1.0% previous.
- Federal Reserve Chair Jerome Powell Speech.
إخلاء المسؤولية: الآراء الواردة هنا تعبر فقط عن رأي الكاتب، ولا تمثل الموقف الرسمي لـ Followme. لا تتحمل Followme مسؤولية دقة أو اكتمال أو موثوقية المعلومات المُقدمة، ولا تتحمل مسؤولية أي إجراءات تُتخذ بناءً على المحتوى، ما لم يُنص على ذلك صراحةً كتابيًا.

اترك رسالتك الآن