


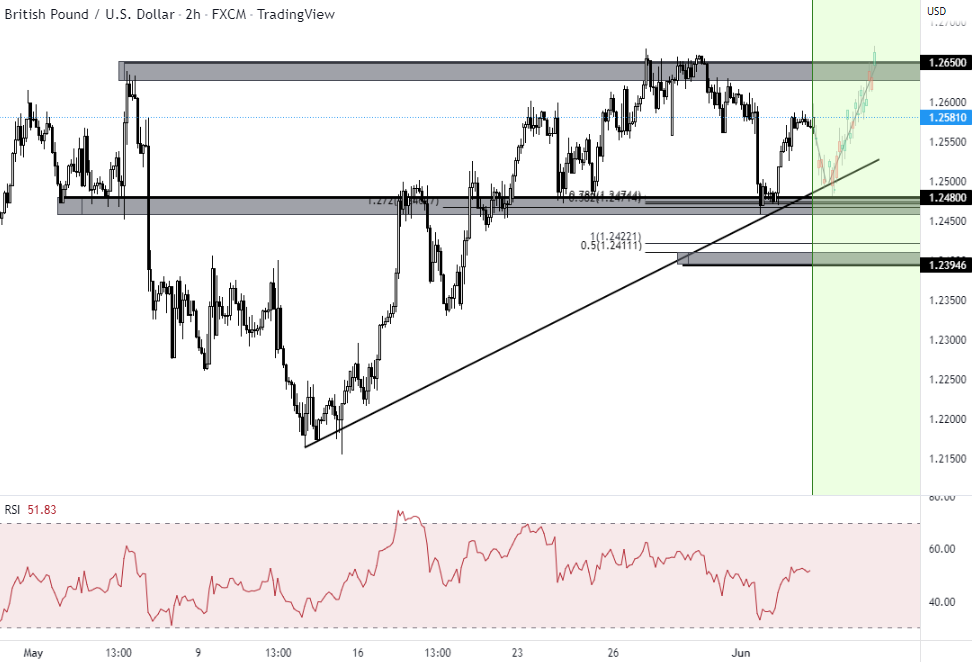
On the daily time frame, prices broke above a key resistance area signalling bullish order flow, with bullish divergence seen on the RSI . On the H2 time frame, a throwback to the support area at 1.2480, which coincides with the graphical support area , ascending trend line , 38.2% Fibonacci retracement , 1.272% and 78.6% Fibonacci extension presents an opportunity to play the bounce, with 1.2650 as the resistance target. RSI is seeing room for more upside before it reaches it’s the overbought region as well.
إخلاء المسؤولية: الآراء الواردة هنا تعبر فقط عن رأي الكاتب، ولا تمثل الموقف الرسمي لـ Followme. لا تتحمل Followme مسؤولية دقة أو اكتمال أو موثوقية المعلومات المُقدمة، ولا تتحمل مسؤولية أي إجراءات تُتخذ بناءً على المحتوى، ما لم يُنص على ذلك صراحةً كتابيًا.

