


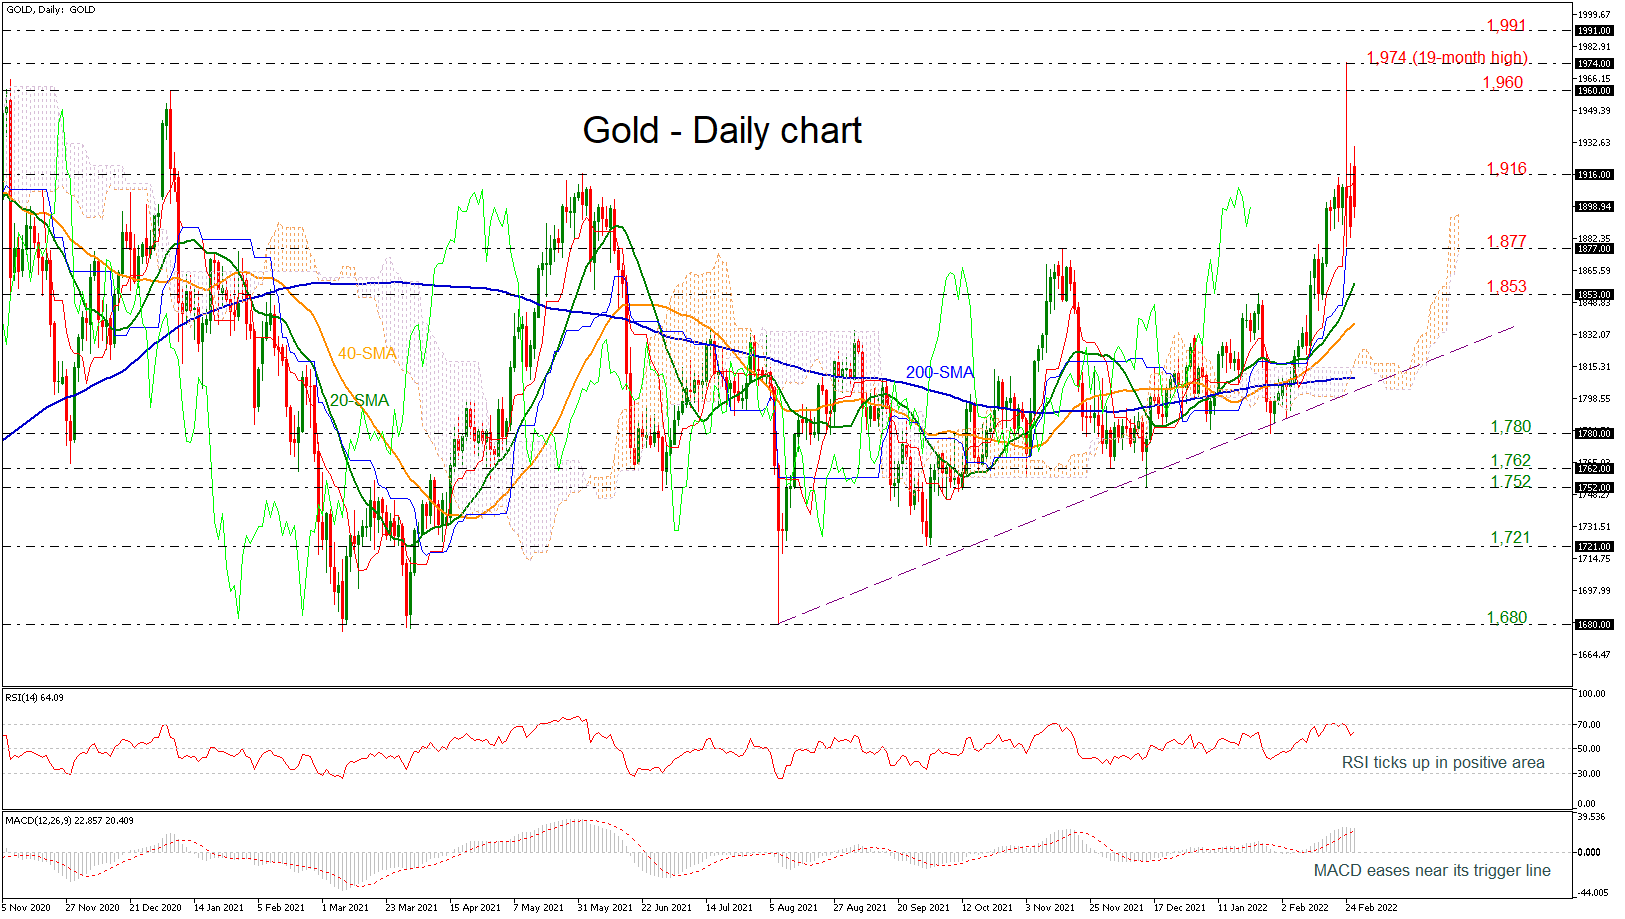
Gold prices started the day with a positive gap, but they quickly declined lower, unable to re-challenge the 19-month high of 1,974. The RSI indicator is showing some positive signs as it is pointing upwards in the bullish region; however, the MACD is approaching its trigger line for a bearish cross above its zero level.
In case there are steeper declines the next immediate support could come from the 1,877 barrier and then from the 20-day simple moving average (SMA) at 1,859 ahead of the 1,853 support level. More downside pressures could visit the 40-day SMA at 1,837 and the 200-day SMA at 1,808, which encapsulates the long-term ascending trend line and the Ichimoku cloud. Any moves below these obstacles could open the window for a bearish market in the short-term view.
On the other hand, a climb above the strong resistance at 1,916 could take the bulls until the 1,960 barrier, taken from the peak on January 2021 before meeting again the 19-month top of 1,974. Above these hurdles, the next stop could come from the 1,991 mark, registered in August 2020.
All in all, the yellow metal is creating a negative move after the aggressive spike towards the multi-month high in the previous week. However, the broader picture is still bullish and only a fall below the 200-day SMA and the uptrend line may change this view.
إخلاء المسؤولية: الآراء الواردة هنا تعبر فقط عن رأي الكاتب، ولا تمثل الموقف الرسمي لـ Followme. لا تتحمل Followme مسؤولية دقة أو اكتمال أو موثوقية المعلومات المُقدمة، ولا تتحمل مسؤولية أي إجراءات تُتخذ بناءً على المحتوى، ما لم يُنص على ذلك صراحةً كتابيًا.

