


Ether (ETH) bounced off the support line of the descending channel on Jan. 10, suggesting that bulls are attempting to defend this level with vigor. The price could reach the overhead zone between the 20-day EMA ($3,536) and the resistance line of the channel.
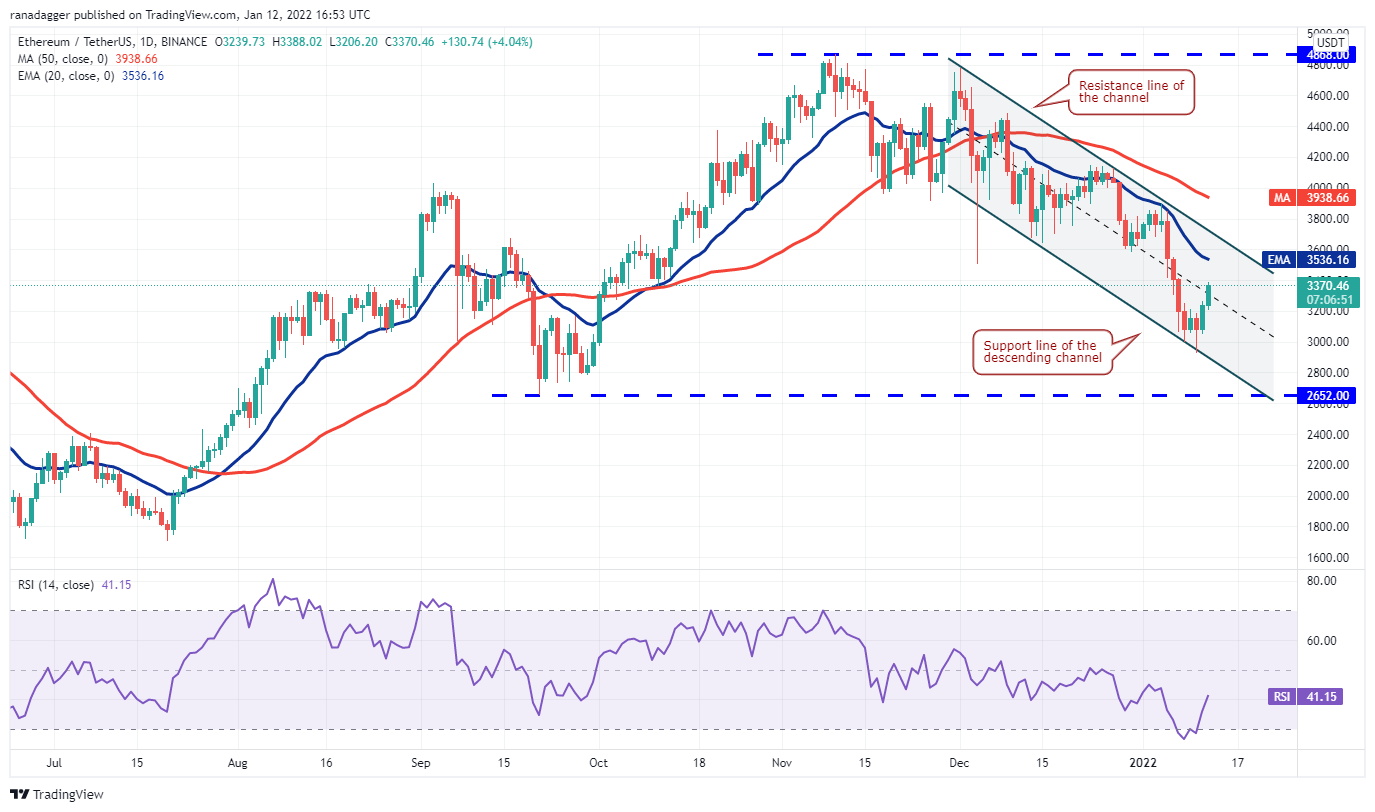
Both moving averages are trending down and the RSI is in the negative zone, indicating that bears have the upper hand. If the price turns down from the overhead zone, it will suggest that sentiment remains negative and traders are selling on rallies. The bears will then attempt to pull the ETH/USDT pair to the support line of the channel.
On the other hand, if bulls push the price above the overhead zone, the pair could rise to the 50-day SMA ($3,938). A break and close above this resistance will suggest a possible change in trend.
إخلاء المسؤولية: الآراء الواردة هنا تعبر فقط عن رأي الكاتب، ولا تمثل الموقف الرسمي لـ Followme. لا تتحمل Followme مسؤولية دقة أو اكتمال أو موثوقية المعلومات المُقدمة، ولا تتحمل مسؤولية أي إجراءات تُتخذ بناءً على المحتوى، ما لم يُنص على ذلك صراحةً كتابيًا.

