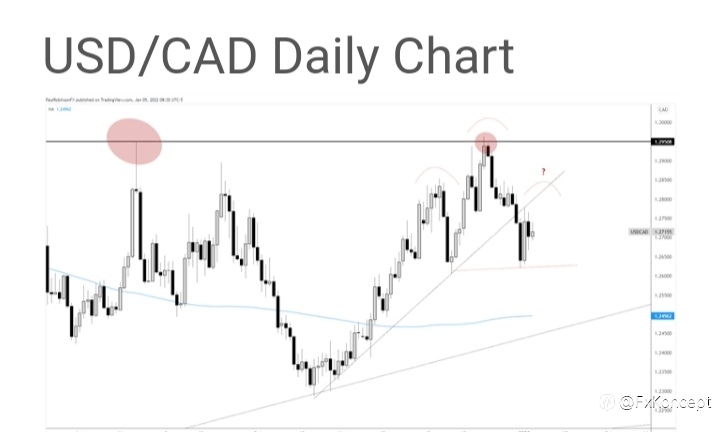
The last time I wrote about USD/CAD it was up against a major level, 12950 – it extends over from 2019 and had been validated as a meaningful level on numerous occasions. The mid-December test further validated its meaning.
But it doesn’t look like it will be tested again any time in the very near future as a bearish formation develops by way of a head-and-shoulders pattern. The pattern has yet to fully mature with a right shoulder, but could do-so soon.
The October trend-line was broken and seen as having already, or perhaps with one more push higher, capping strength. A turn lower and break of the neckline and 12606 is seen as validating the bearish head-and-shoulders pattern.
Given the height of the pattern the projected move could take USD/CAD back to the October low under 12300. But before getting to that point the June trend-line and gradually rising 200-day moving average (currently at 12496) would be considered a solid form of support to watch.
On the flip-side, should we see price stay above the neckline and recent lows down to 12606, then the outlook will remain neutral with only a very short-term negative bias. The key is for the H&S pattern to break for sellers to truly gain the upper hand.
إخلاء المسؤولية: الآراء الواردة هنا تعبر فقط عن رأي الكاتب، ولا تمثل الموقف الرسمي لـ Followme. لا تتحمل Followme مسؤولية دقة أو اكتمال أو موثوقية المعلومات المُقدمة، ولا تتحمل مسؤولية أي إجراءات تُتخذ بناءً على المحتوى، ما لم يُنص على ذلك صراحةً كتابيًا.

اترك رسالتك الآن