


· Views 278
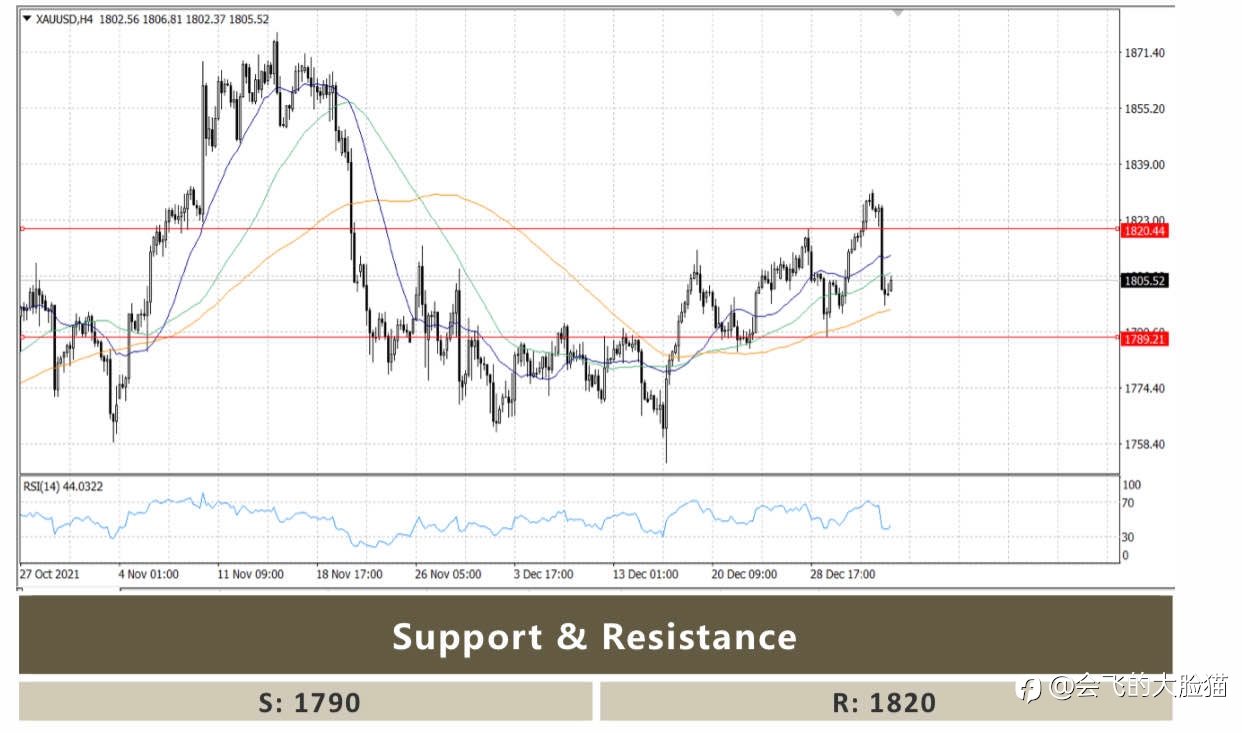
#XAU/USD# The 4-hour chart shows that the price has fallen below its 20 and 200 SMAs, while approaching a mildly bullish 100 SMA, reflecting sellers’ strength. Meanwhile, the Momentum indicator is crossing its midline into negative territory, while the RSI indicator heads lower at around 44, all of which hints at a bearish continuation, particularly on a break below $1,790, the immediate support level. #gold#
إخلاء المسؤولية: الآراء الواردة هنا تعبر فقط عن رأي الكاتب، ولا تمثل الموقف الرسمي لـ Followme. لا تتحمل Followme مسؤولية دقة أو اكتمال أو موثوقية المعلومات المُقدمة، ولا تتحمل مسؤولية أي إجراءات تُتخذ بناءً على المحتوى، ما لم يُنص على ذلك صراحةً كتابيًا.
هل أعجبك هذا المقال؟ عبّر عن امتنانك بإرسال نصيحة للكاتب.

