


· Views 18,142
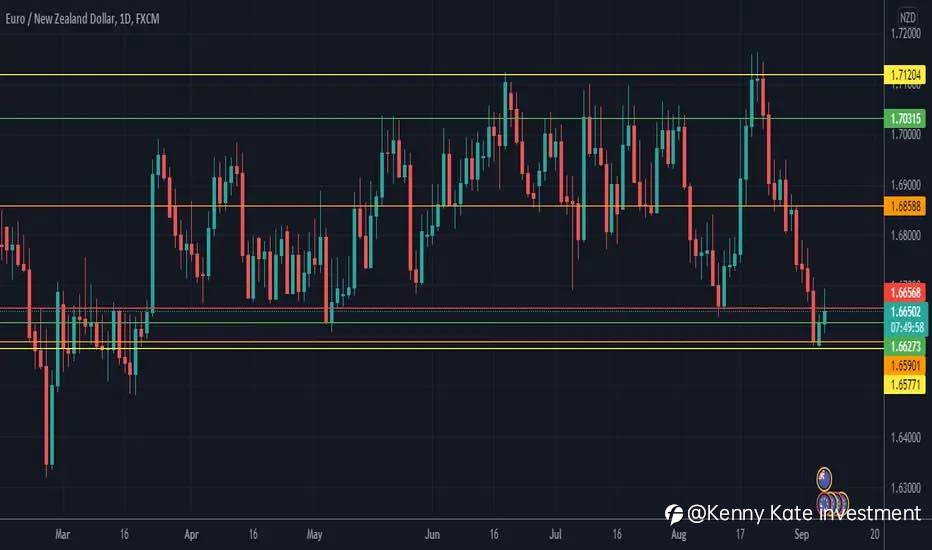
In the H4 timeframe, you can see the market has already formed a double bottom however in the chart you can see the market is currently at the red line. We want to see a break to the upside by this a mean a close of the daily candle above the red line so that we can have a bullish chance. Otherwise, if the market remains below the red line there will a great chance for a bearish trade.
Good luck
Good luck
إخلاء المسؤولية: الآراء الواردة هنا تعبر فقط عن رأي الكاتب، ولا تمثل الموقف الرسمي لـ Followme. لا تتحمل Followme مسؤولية دقة أو اكتمال أو موثوقية المعلومات المُقدمة، ولا تتحمل مسؤولية أي إجراءات تُتخذ بناءً على المحتوى، ما لم يُنص على ذلك صراحةً كتابيًا.
هل أعجبك هذا المقال؟ عبّر عن امتنانك بإرسال نصيحة للكاتب.

