



ByLCMS Traders FX Analysis Team
JUL 15, 2021
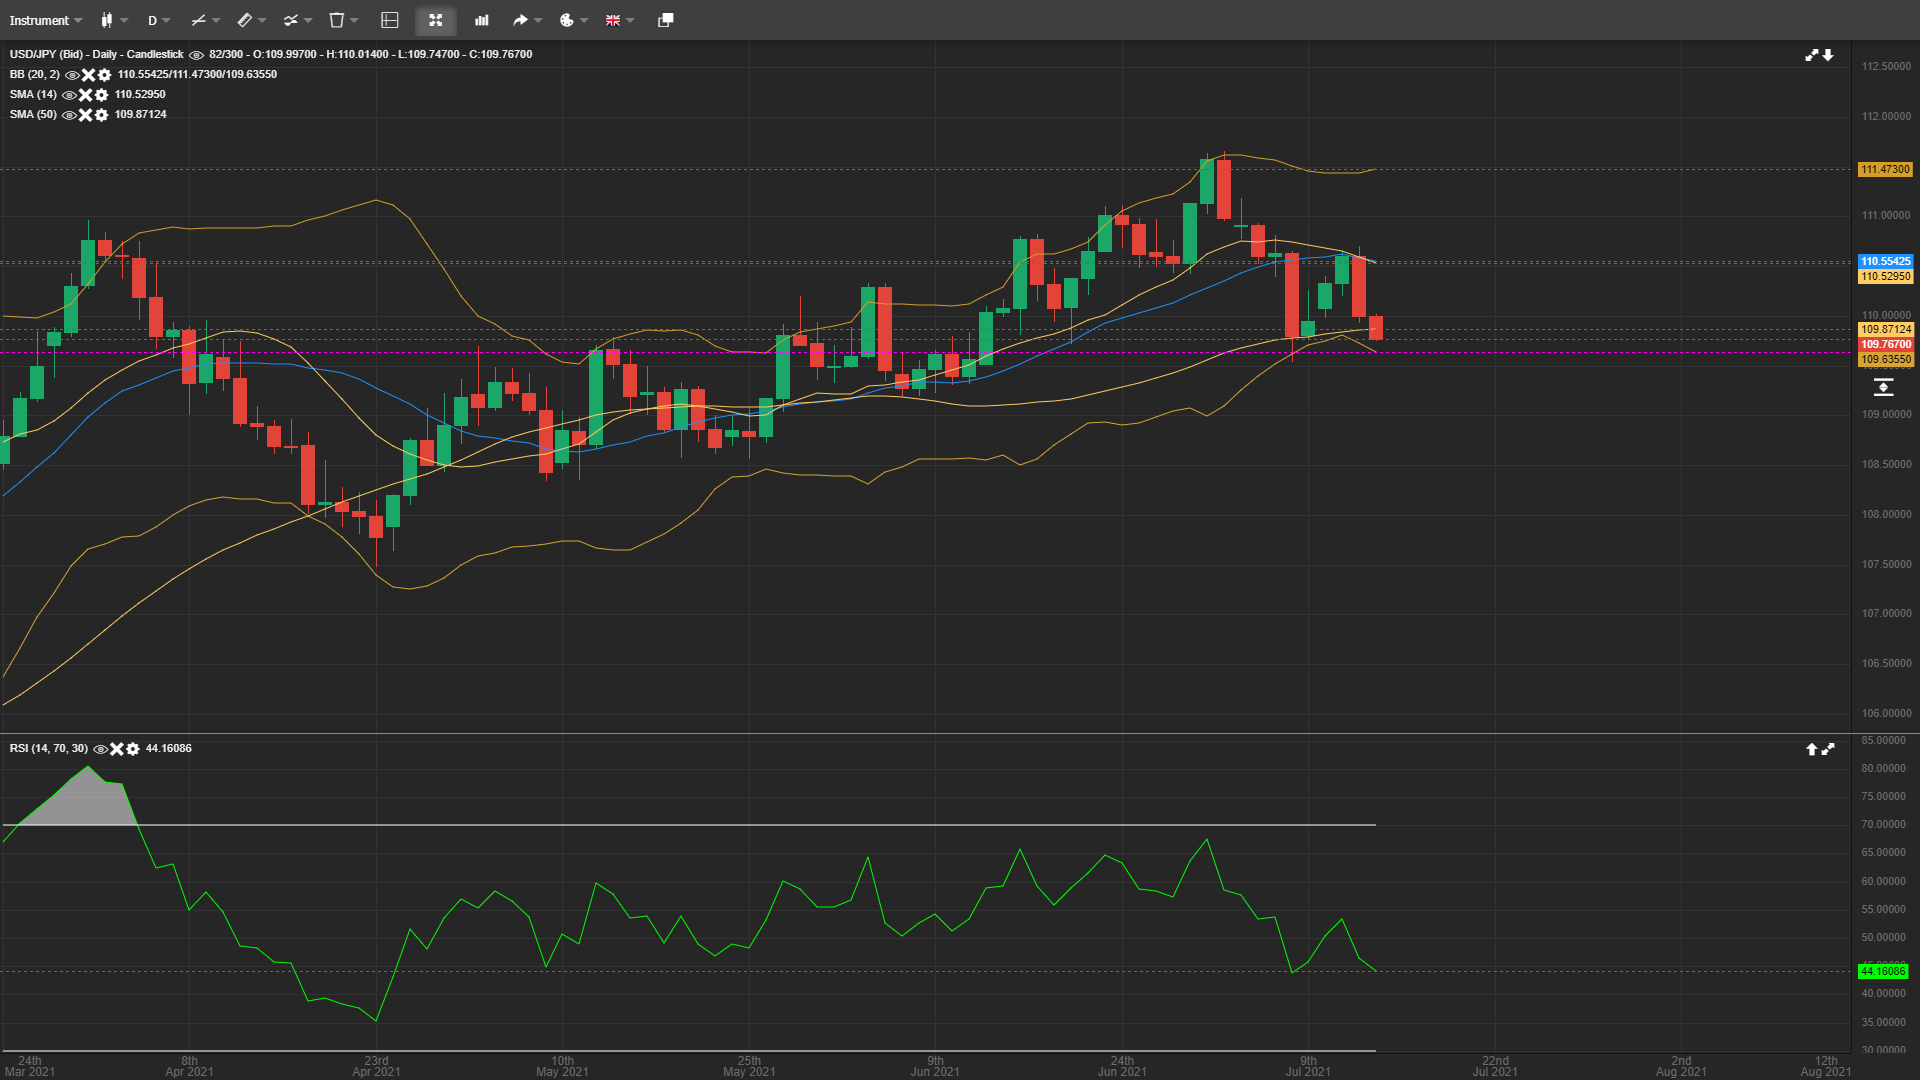
USD/JPY dropped nearly 60 yesterday and is currently trading further lower to 109.76. The intraday support levels are at 10.9.60 and 109.35. The near-term resistance areas are at 110.10 and 110.54.
The intraday charts are presenting a bearish picture. The SMA-14 is indicating resistance at 110.52 and the SMA-50 support line is at 109.87. The RSI is at 44 and has a downwards curve. The MACD is below the middle line and indicating a bearish trajectory. The pair is also keeping below the mid-Bollinger band (110.55). The current price range (109.70) was previous held during the last week however, the intraday and 4 hourly charts now suggest further weakness which makes the pair ideal for short entries using the following levels.
Direction: Sell
Entry: 110.00
Take Profit: 109.45
Stop-Loss: 110.36
An intraday closing below 109.50 would be an indication of further weakness and a lower weekly closing. On the upside, a sustained price action above 110.30 is needed for the bulls to get back into the game.
إخلاء المسؤولية: الآراء الواردة هنا تعبر فقط عن رأي الكاتب، ولا تمثل الموقف الرسمي لـ Followme. لا تتحمل Followme مسؤولية دقة أو اكتمال أو موثوقية المعلومات المُقدمة، ولا تتحمل مسؤولية أي إجراءات تُتخذ بناءً على المحتوى، ما لم يُنص على ذلك صراحةً كتابيًا.

