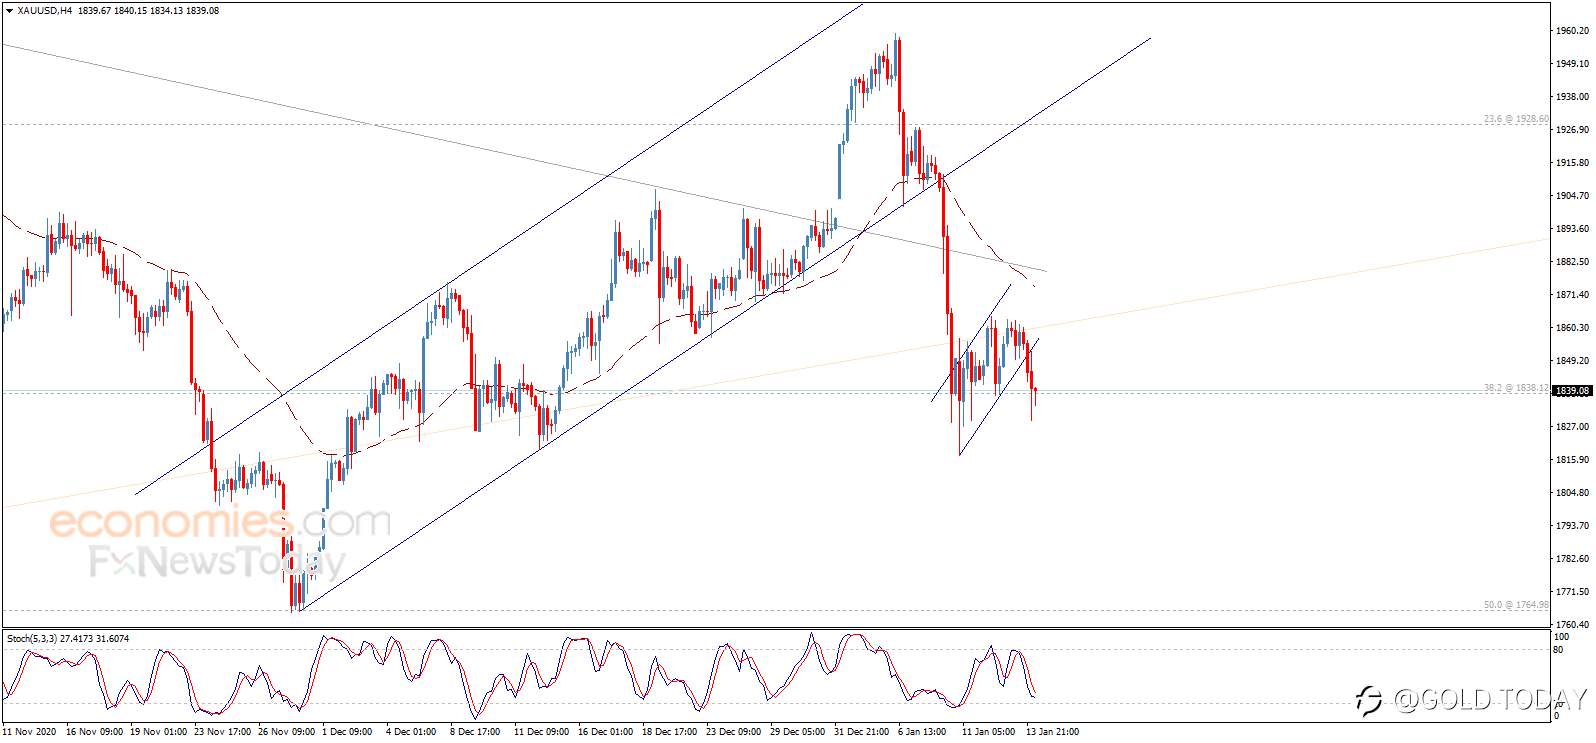
Illustration photo of Gold Price H4 Chart from economies.com
Yesterday, gold prices faced negative pressure to break the support line of the minor bullish channel that appears on the chart. This forms a bearish flag pattern that pushes the price to achieve more decline now, as the price begins today with additional bearish bias to attack $1838.10. Expect to see more decline in the coming sessions, targeting $1800 on the near-term basis.
The 50-day exponential moving average (EMA50) supports the proposed bearish bias and will remain valid unless the price rallied to break the $1855.70 mark.
Trading range for today is expected to be between $1815 support and $1855 resistance.
Meanwhile, today’s trend is expected to be bearish.
FOLLOWME XAU/USD Overall Sentiment (As of 5:18 p.m., Jan 14, 2021)
Short - 50.00%
Long - 50.00%
Source: economies.com
إخلاء المسؤولية: الآراء الواردة هنا تعبر فقط عن رأي الكاتب، ولا تمثل الموقف الرسمي لـ Followme. لا تتحمل Followme مسؤولية دقة أو اكتمال أو موثوقية المعلومات المُقدمة، ولا تتحمل مسؤولية أي إجراءات تُتخذ بناءً على المحتوى، ما لم يُنص على ذلك صراحةً كتابيًا.

-النهاية-