· Views 688
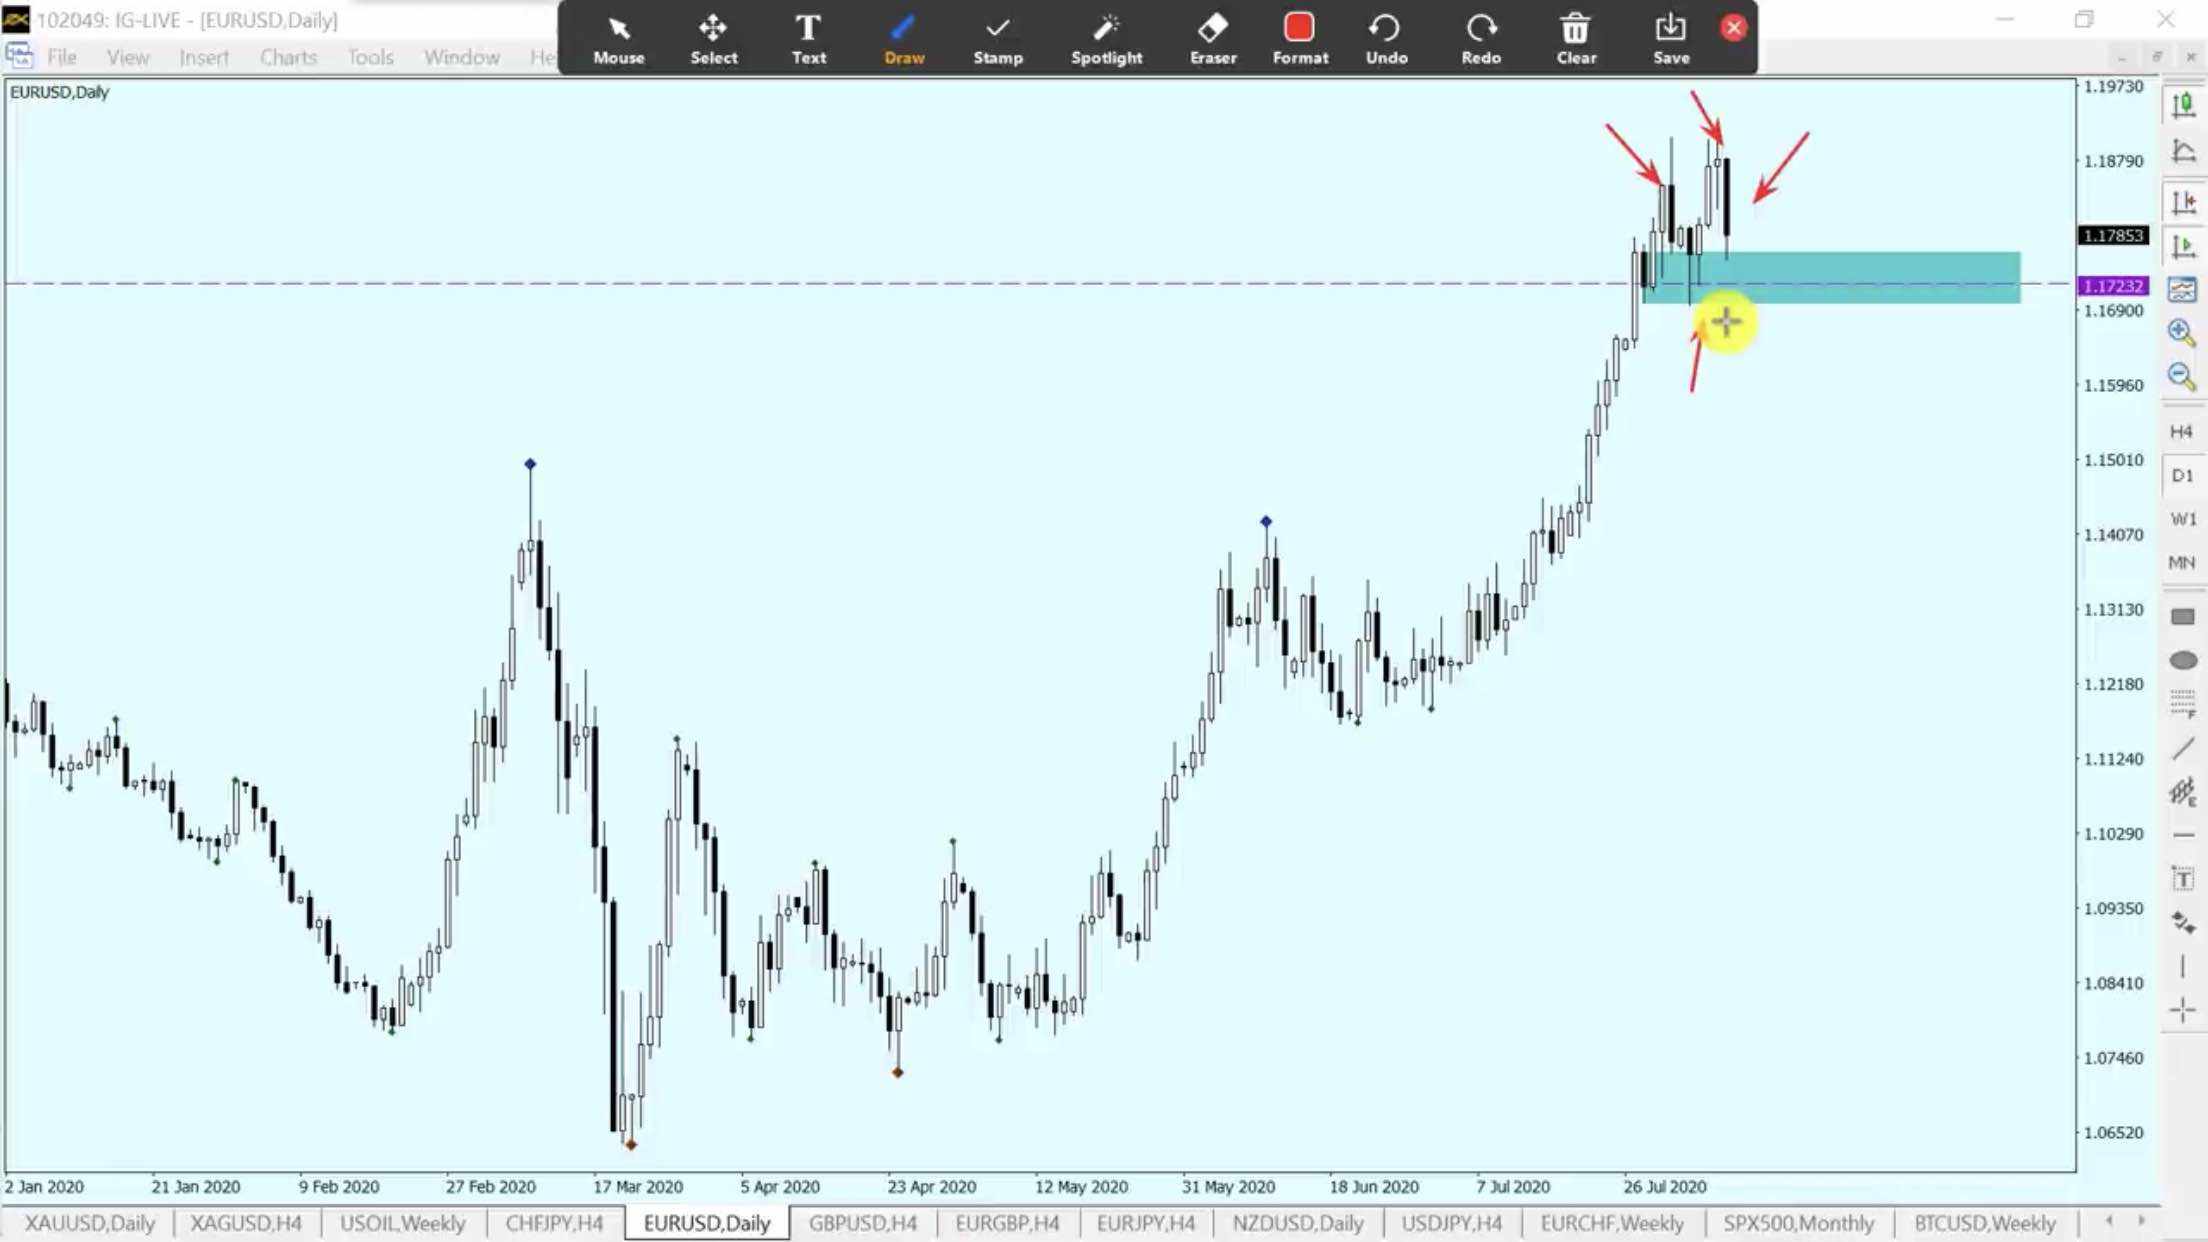
On the daily chart, we can the Selling candles but dont be traped by the market, it's just a re-test candle after a long wave up. There 2 pin bars up we can see on the D1 chart here, that means we can BUY from there.
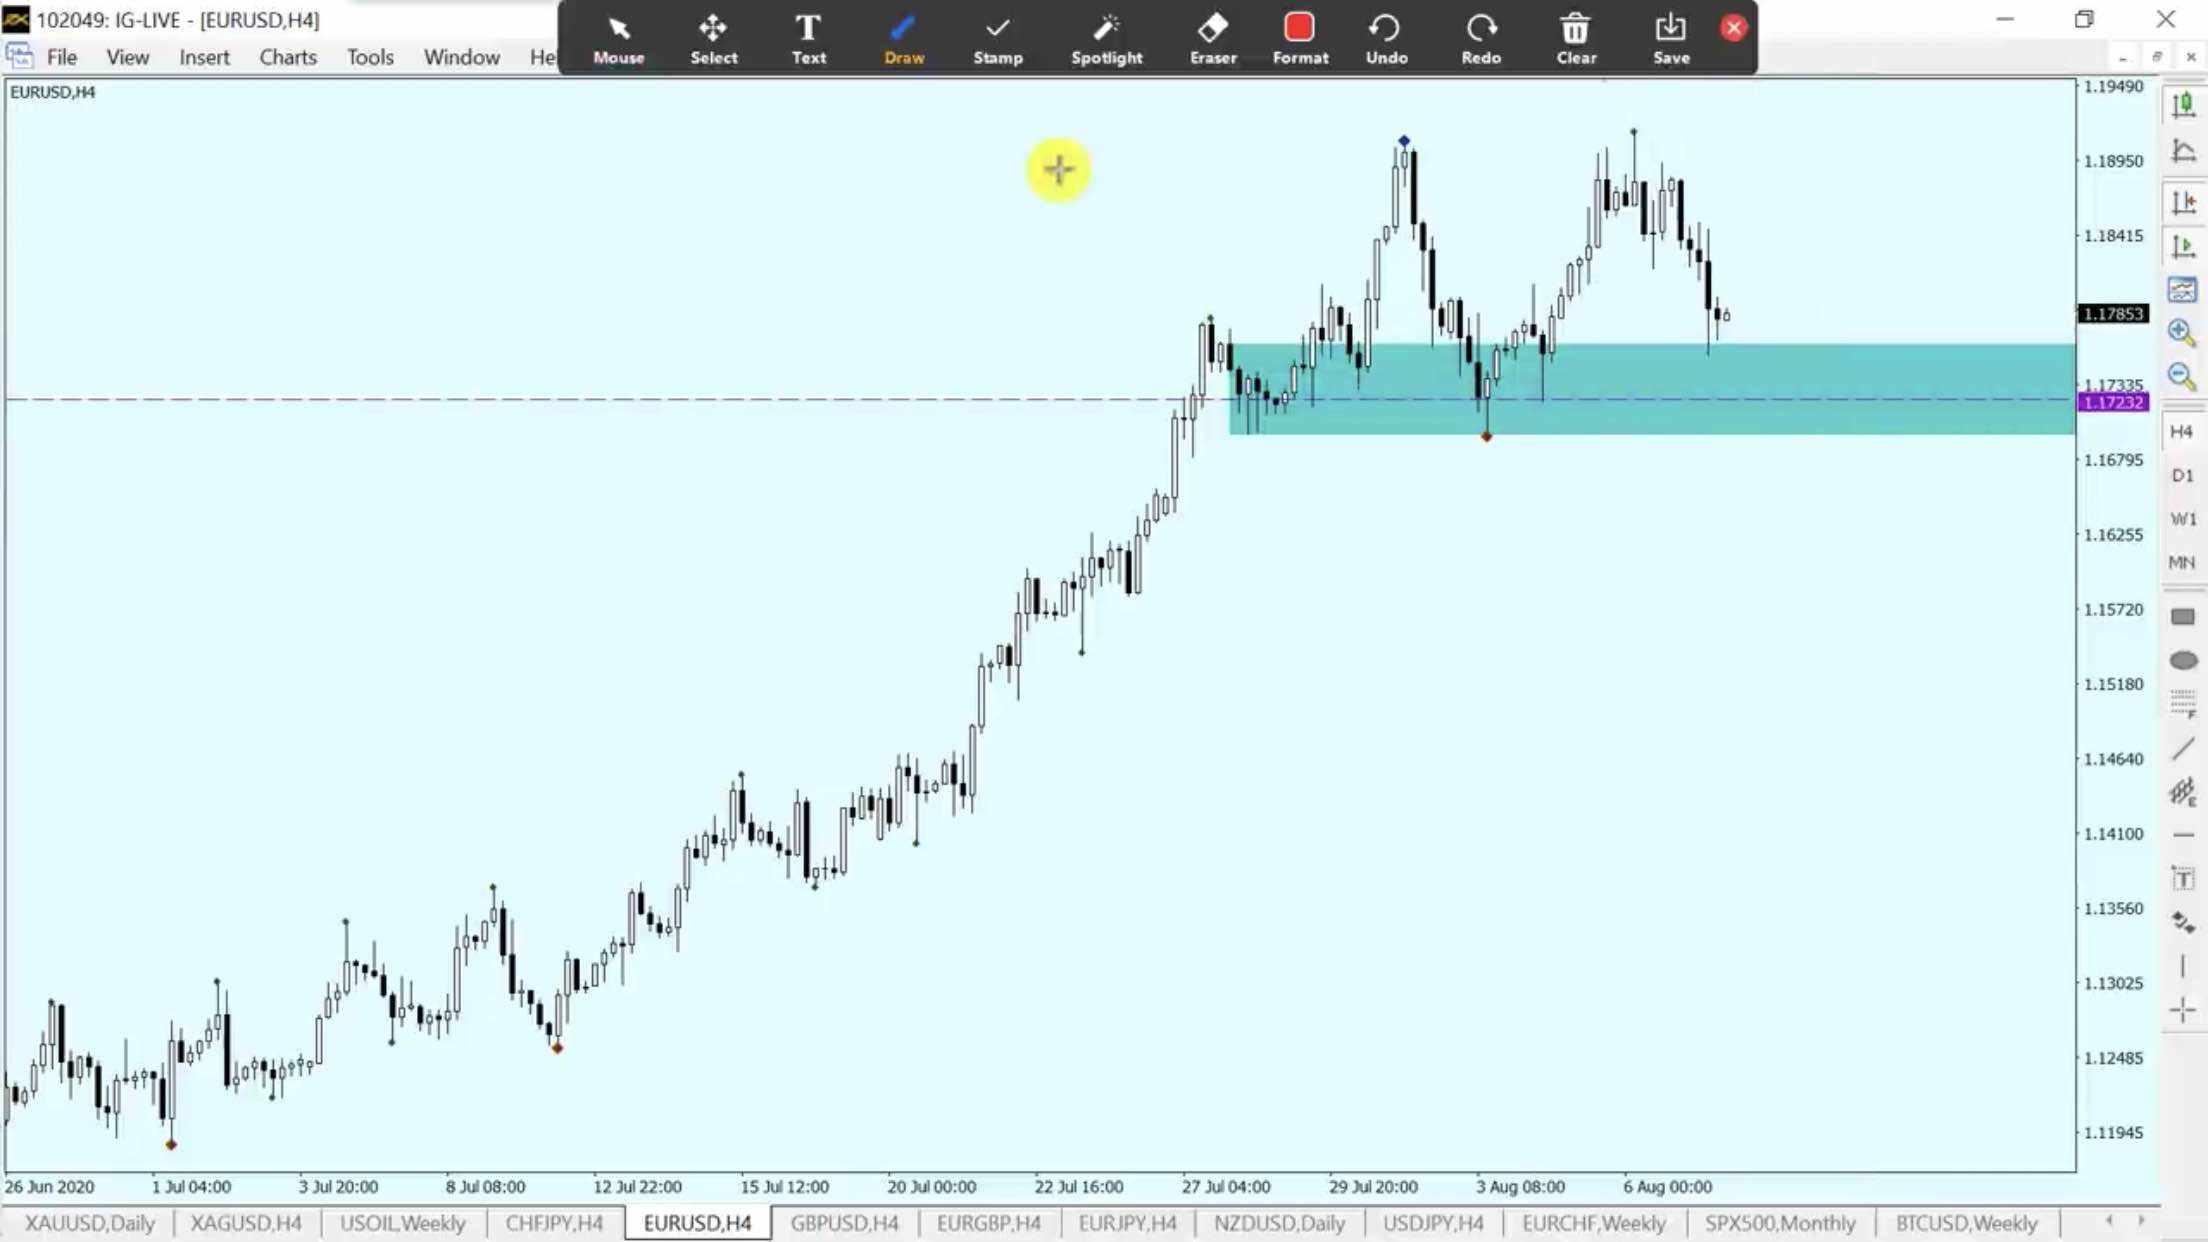
On the H4 chart, we can see clearly about the support area at the price 1.17232. Please wait for the price to arrive this area and a signal like pin bar up or inside bar to Buy.
Or you can BUY Limit at 1.17232, Stop loss at 1.16940, take profit at 1.1920 or 1.2000
This is my own opinion about the market, please always put stop loss to advoid risk.
إخلاء المسؤولية: الآراء الواردة هنا تعبر فقط عن رأي الكاتب، ولا تمثل الموقف الرسمي لـ Followme. لا تتحمل Followme مسؤولية دقة أو اكتمال أو موثوقية المعلومات المُقدمة، ولا تتحمل مسؤولية أي إجراءات تُتخذ بناءً على المحتوى، ما لم يُنص على ذلك صراحةً كتابيًا.
هل أعجبك هذا المقال؟ عبّر عن امتنانك بإرسال نصيحة للكاتب.

اترك رسالتك الآن