BRITISH POUND VS NEW ZEALAND TECHNICAL FORECAST
GBP/NZD – STALLED BEARISH SENTIMENT
Last week, GBP/NZD hit a near two-week high of 1.9270. Ultimately, the price retreated and closed a weekly candlestick modestly in the red with a 0.1% loss.
Alongside that, the Relative Strength Index (RSI) remained flat below 50 highlighting a paused bearish momentum.
GBP/NZD DAILY PRICE CHART (JULY 20, 2018 – JULY 23, 2020) ZOOMED OUT

GBP/NZD DAILY PRICE CHART (MAY 20 – JULY 23, 2020) ZOOMED IN
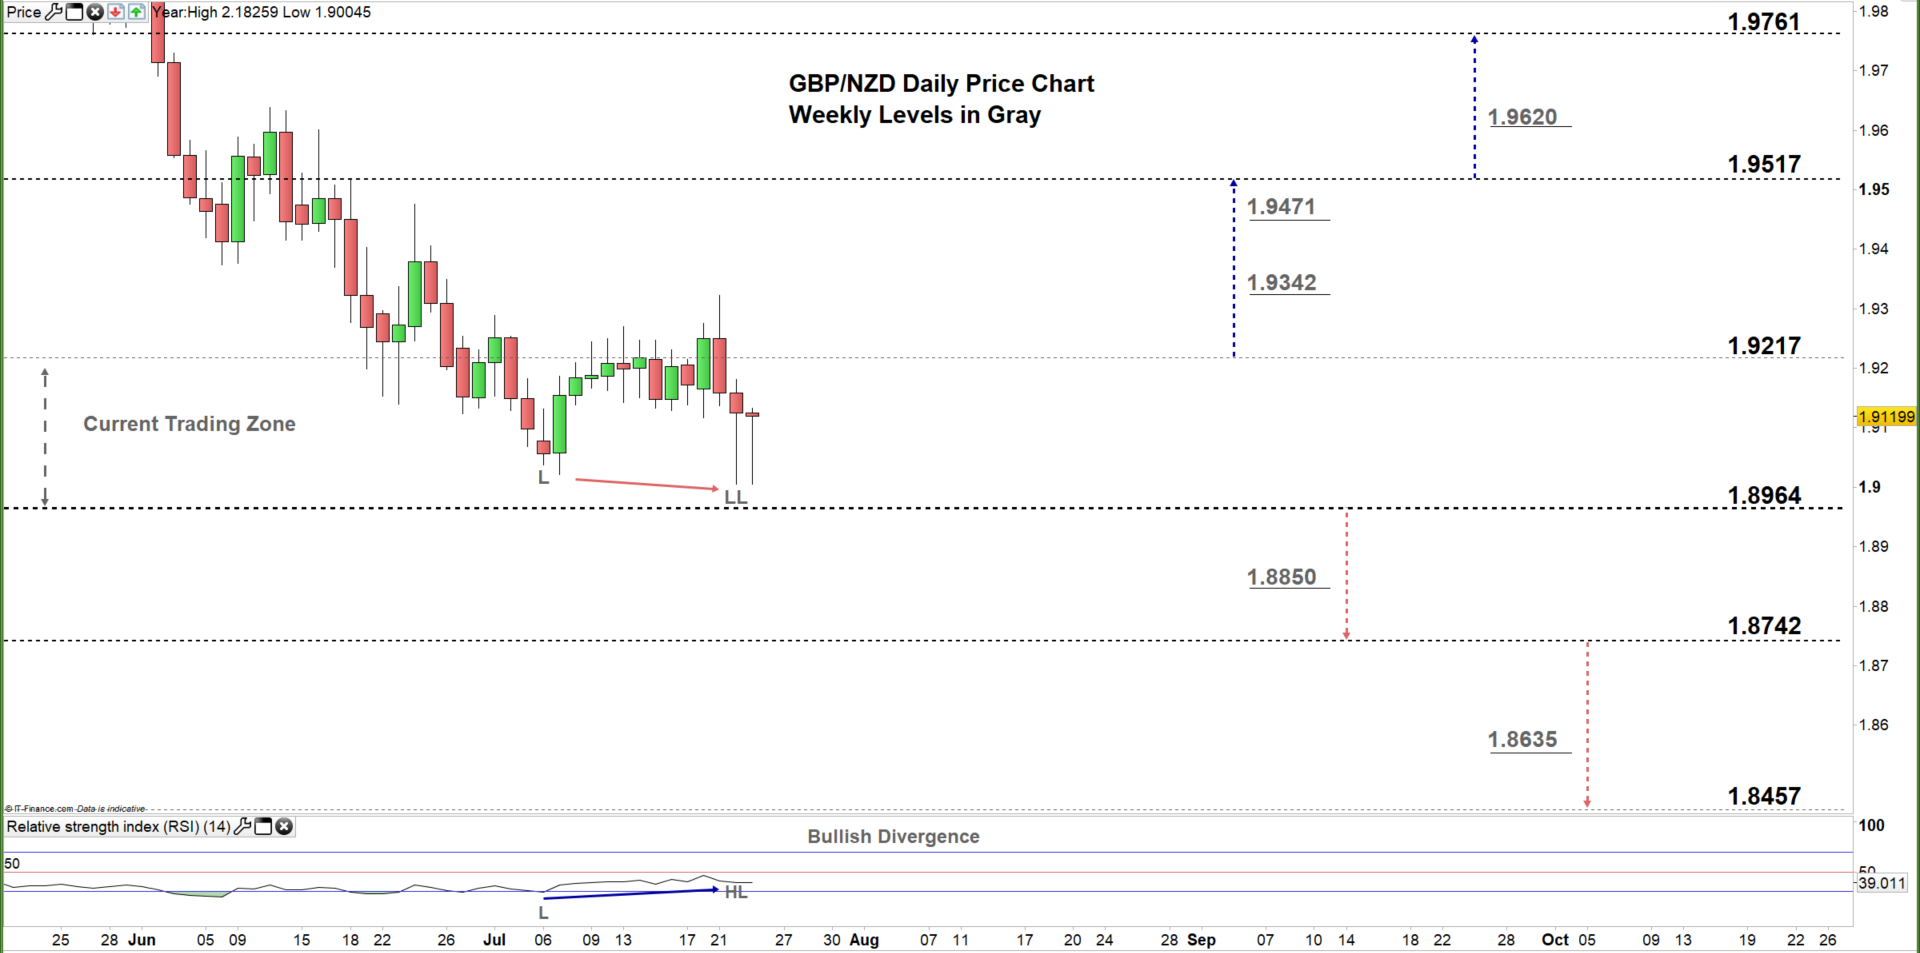
On Tuesday, GBP/NZD declined to the current 1.8964 – 1.9217 trading zone reflecting a indicating that bears were still charge. As a result, the price tumbled yesterday to an over ten-month low of 1.9004.
However, it’s important to note the price/RSI divergence as the first created a low with a lower low, while the latter created a low with a higher low signalling a possible reversal of the downward trend.
A daily close below the low end of the current trading zone may guide GBPNZD’s fall towards the Sep 2017-high at 1.8742.
On the flip-side, a failure in closing below the low end of the zone may start a rally towards the high end of it, and a further close above that could embolden bulls to lead the way towards the June 18 high at 1.9517.
GBP/NZD FOUR HOUR PRICE CHART (MAY 24 – JULY 23, 2020)

Yesterday, GBP/NZD traded below the bullish trendline support originating from the July 7 low at 1.9021, indicating that bearish momentum was still in place.
With that said, the price developed a Double Bottom pattern reflecting a possible reversal on the horizon. A break above the neckline of this pattern located at 1.9140 could reverse the pair’s direction higher.
To conclude, this week the pair resumed bearish price action, although the price/RSI divergence discussed above on the daily chart provides a good base of a possible reversal. Therefore, a break above aforementioned neckline resistance could trigger a rally towards the high end of the current trading zone discussed above at 1.9217, while any break below 1.8943 may send GBPNZD towards 1.8850. As such, the weekly support and resistance levels underlined on the four-hour chart should be considered.
Reprinted from dailyfx, the copyright all reserved by the original author.
إخلاء المسؤولية: الآراء الواردة هنا تعبر فقط عن رأي الكاتب، ولا تمثل الموقف الرسمي لـ Followme. لا تتحمل Followme مسؤولية دقة أو اكتمال أو موثوقية المعلومات المُقدمة، ولا تتحمل مسؤولية أي إجراءات تُتخذ بناءً على المحتوى، ما لم يُنص على ذلك صراحةً كتابيًا.

اترك رسالتك الآن