Home › Intermediate › Module 1: Comprehensive Technical Analysis › Article 6 of 6
There are two ways to profit from a trend: try to catch the reversal early (reversal, high risk), or wait for the trend to pause and join it as it continues (continuation, higher probability). This article covers the second approach, which is often safer and easier to measure.
Part 1
What Is a Continuation Pattern, and Why Is It Easier to Trade
The psychology behind consolidation, and why following an existing trend is more profitable than guessing a reversal
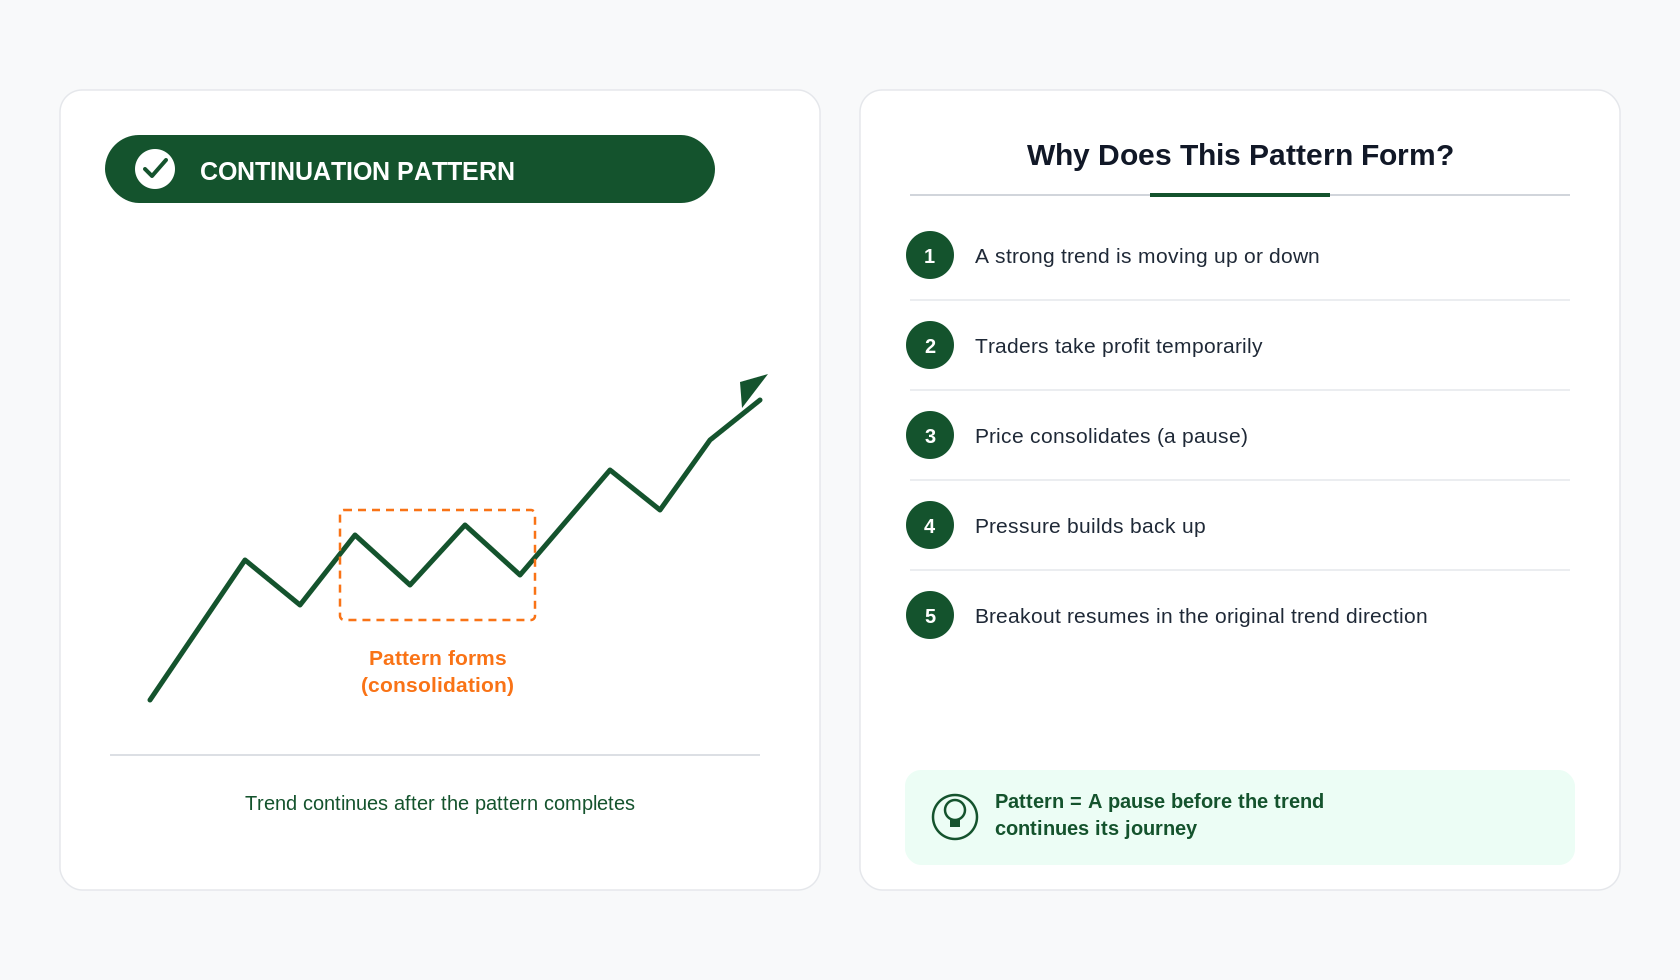
Every strong trend eventually pauses. Institutions take partial profits, retail traders hesitate, and price moves sideways for a while. During this pause, pressure in the direction of the real trend builds back up. Once it is strong enough, price breaks out again in the same direction. This is what is called a continuation pattern:
Left: A visual example of how a continuation pattern forms during an uptrend. Consolidation forms inside the orange box, then the trend continues upward again. Right: The five psychological stages that cause this pattern to form.
⚖️
Continuation vs. Reversal: Which Is More Profitable for Beginners?
Reversal patterns aim to catch a trend reversal. The profit potential is large if you are right, but false signals are very common and timing is difficult. Continuation patterns wait for the trend to resume. The profit potential is smaller, but the probability is higher and the target is easier to measure. For traders at this stage, mastering continuation patterns first should be the priority.
Part 2
Triangles: Three Variations, Three Biases
How to tell them apart and read the bias of each in about a minute per variation
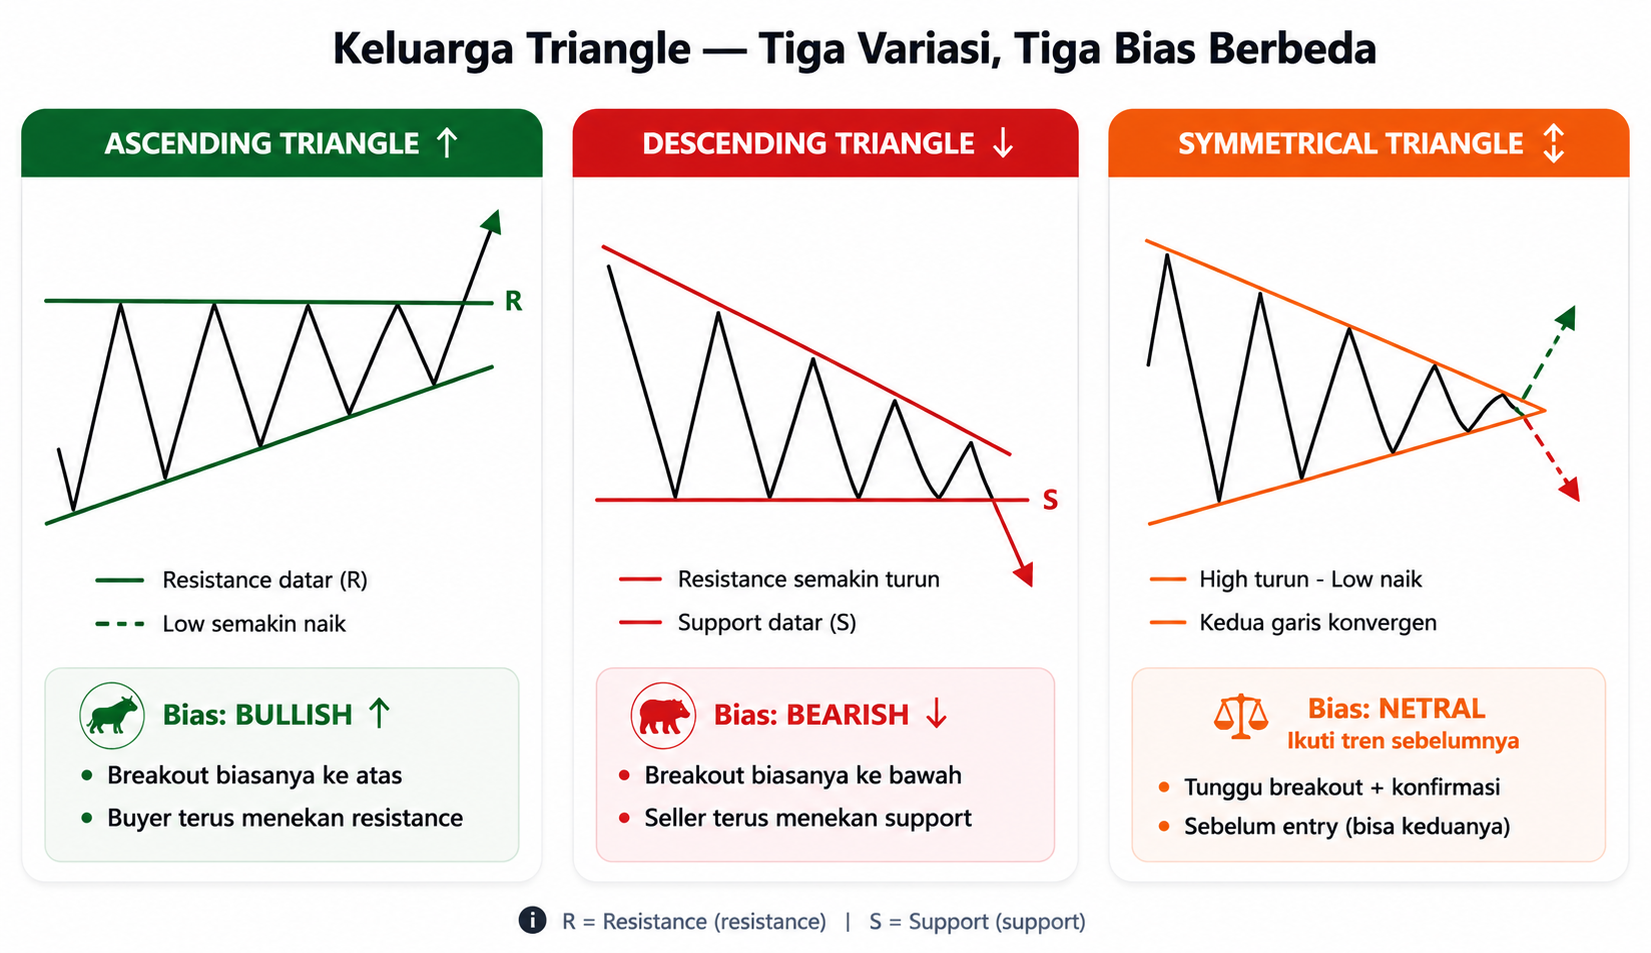
A triangle is a pattern that forms when the price range gradually narrows (converges) over a period of time. There are three variations, and each reveals different information about the relative strength of buyers versus sellers:
From left to right: Ascending Triangle (flat resistance, rising lows = aggressive buyers = bullish bias), Descending Triangle (flat support, falling highs = aggressive sellers = bearish bias), Symmetrical Triangle (both lines converge = no dominant side, follow the prior trend).
How to draw it: Draw a horizontal line across the equal highs (resistance). Draw a rising diagonal line connecting the progressively higher lows. Place the stop loss below the last low.
How to draw it: Draw a horizontal line across the equal lows (support). Draw a falling diagonal line connecting the progressively lower highs. Place the stop loss above the last high.
How to draw it: Draw two converging lines, one rising below and one falling above. The breakout can go in either direction, but it more often follows the prior trend. Wait for a candle body to close beyond the line.
← Scroll if content is cut off →
Part 3
Flag and Pennant: The Most Reliable Pole Patterns
Both require a strong prior pole. Without a pole, the pattern is not valid
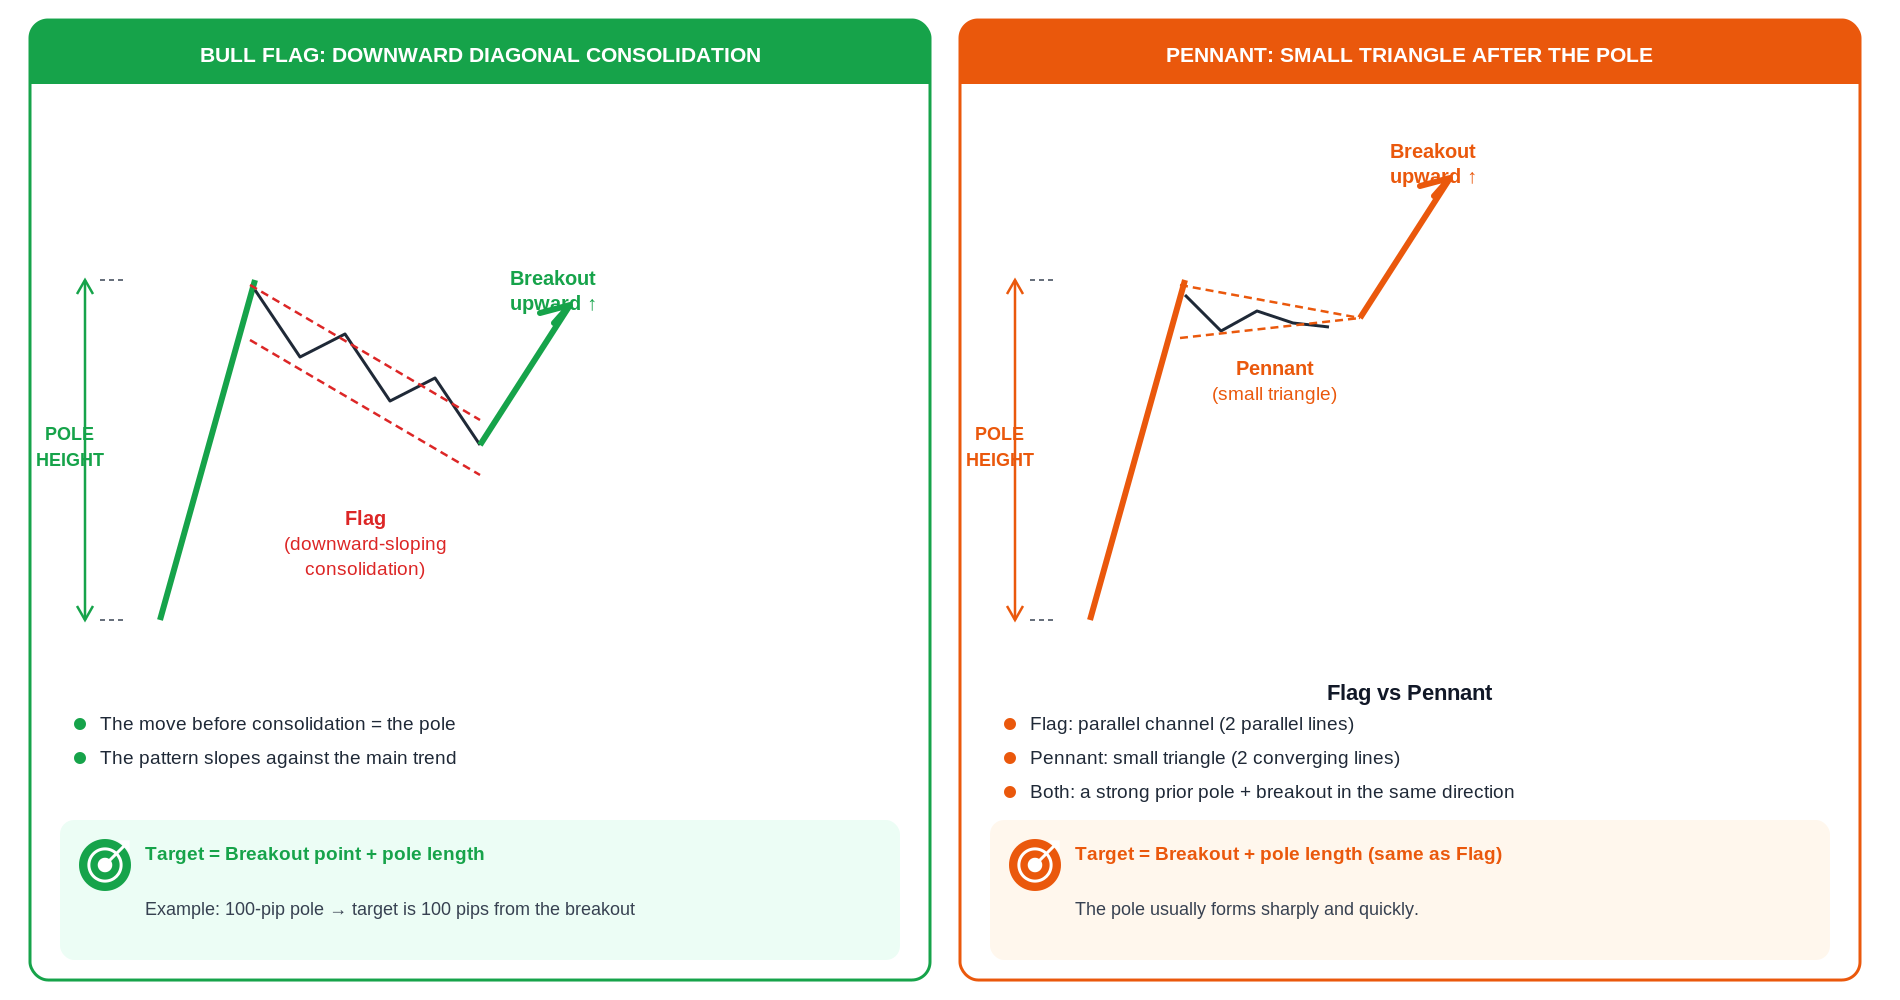
Flags and pennants are swing traders' favorite continuation patterns because they offer a highly measurable target (the length of the pole) and high reliability when the prior pole is genuinely strong. The only difference between the two is the shape of the consolidation:
Left: A Bull Flag, a strong upward pole followed by a downward-sloping consolidation channel (two parallel lines). Target = breakout price plus pole length. Right: A Bull Pennant, a strong pole followed by a small triangle (two converging lines). The target is calculated using the exact same method as the Flag.
⚠️
Without a Strong Pole, a Flag or Pennant Is Not Valid
The most common mistake is labeling an ordinary consolidation as a "flag" when there was no sharp move beforehand. A valid pole must: (1) move at least 5 to 10 times the normal daily range within a short time, (2) show almost no significant pullback while it forms, and (3) show high volume (or a tightening spread). If there is no pole, a pattern that looks like a Flag is just an ordinary consolidation.
Part 4
Wedges: A Pattern With Two Personalities
Rising Wedge is bearish, Falling Wedge is bullish. It feels counterintuitive, but it holds up consistently
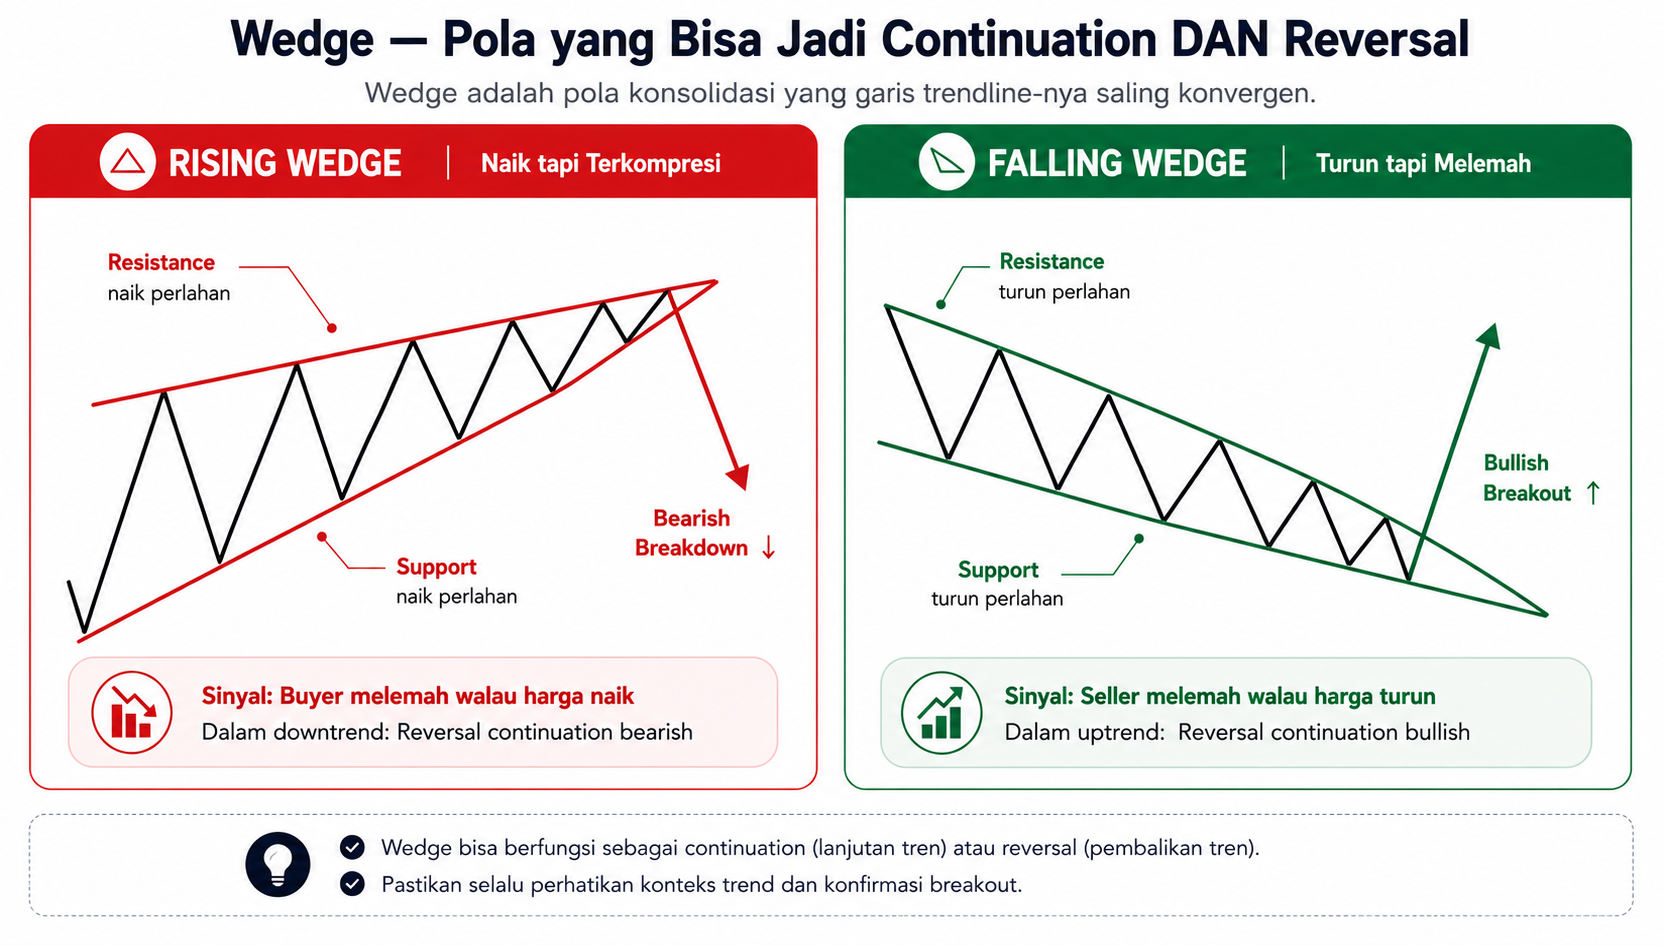
A wedge is a pattern in which two trendlines converge while both slant in the same direction (both rising or both falling). What makes it unique is that the direction of the wedge is the opposite of the expected breakout direction:
Left: Rising Wedge (rising with compression = weakening buyers = bearish breakdown). Right: Falling Wedge (falling with compression = weakening sellers = bullish breakout). This pattern sounds counterintuitive, but it is remarkably consistent, because weakening momentum shows up as the shrinking distance between the two lines.
Part 5
How to Calculate Targets Using the Flagpole Method
A structured process for setting an objective take-profit level, not one based on feeling
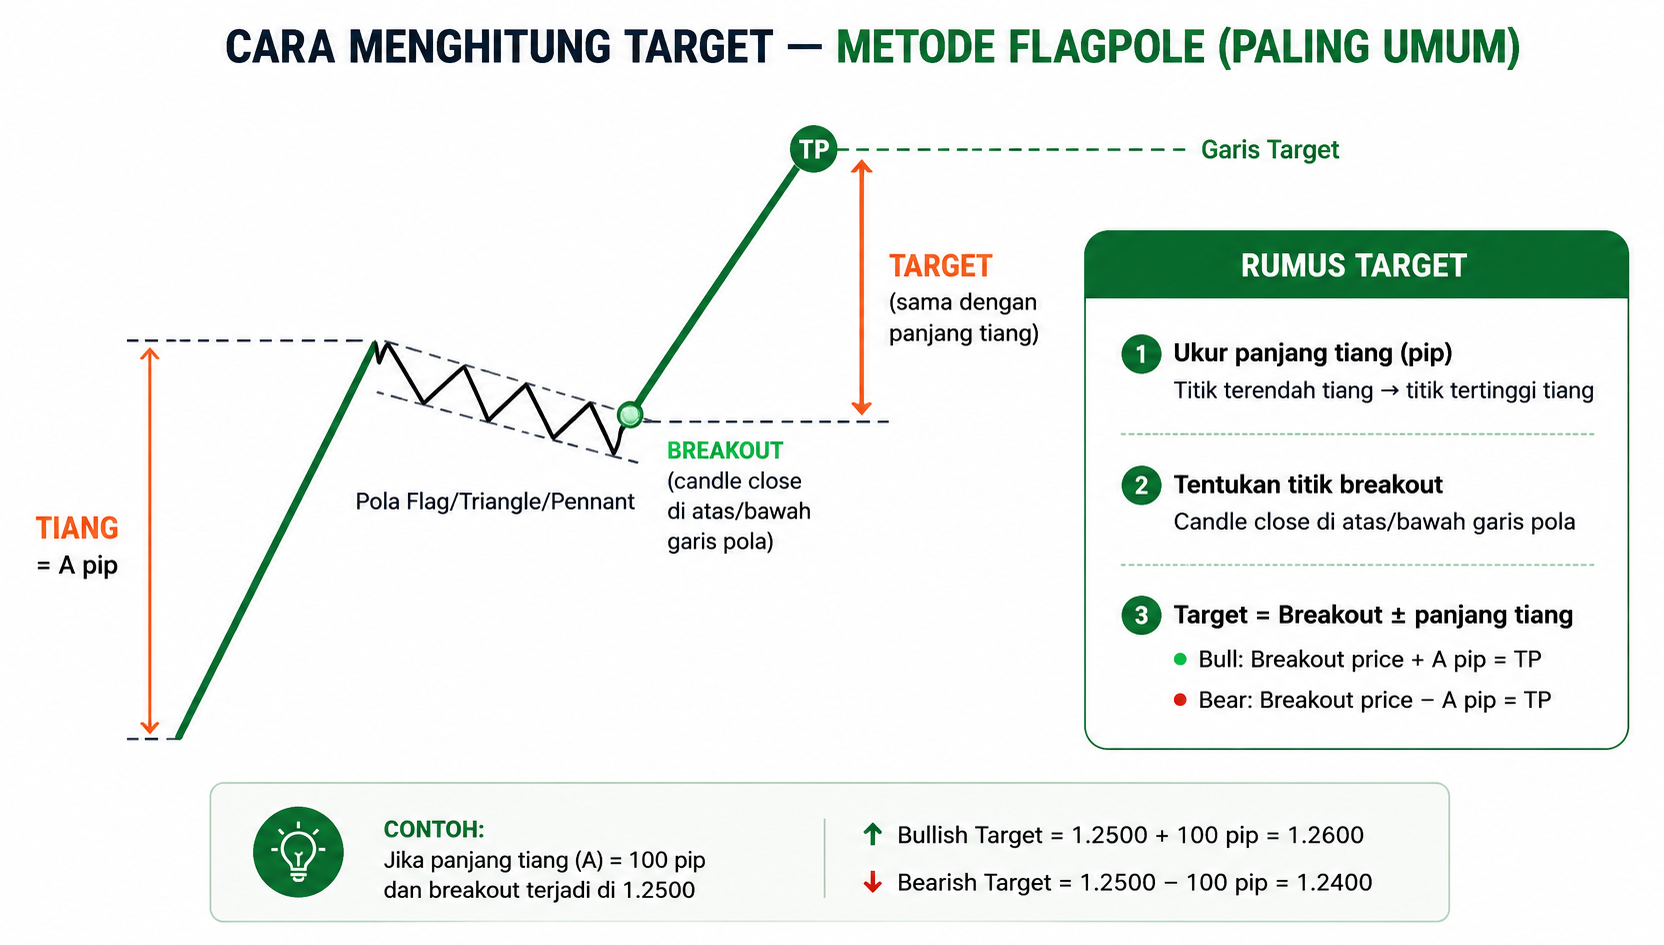
The main advantage of continuation patterns over reversal patterns is that the target can be measured objectively. The most common and most reliable method is the Flagpole Projection:
A complete target-calculation diagram: the pole is measured from its starting point (A) to the highest point before consolidation. That measurement is then projected upward from the breakout point as the target (TP). The formula box shows three concrete steps. The stop loss always sits inside or below the pattern area.
Step 1: Measure the Pole
Identify the starting point of the strong move and its peak. Calculate the difference in pips. Example: from 1.0800 to 1.0950 is a 150-pip pole.
Step 2: The Breakout Point
Mark the price where a candle body first closes outside the pattern boundary. This is the entry point and the starting point for calculating the target.
Step 3: Calculate the Take-Profit
Bullish: breakout price + 150 pips = TP. Bearish: breakout price − 150 pips = TP. Stop loss: below the pattern low (bullish) or above the pattern high (bearish).
← Scroll if content is cut off →
Part 6
False Breakouts: A Mandatory Filter Before Entry
How to tell a false breakout from a valid one, a critical step that determines profitability
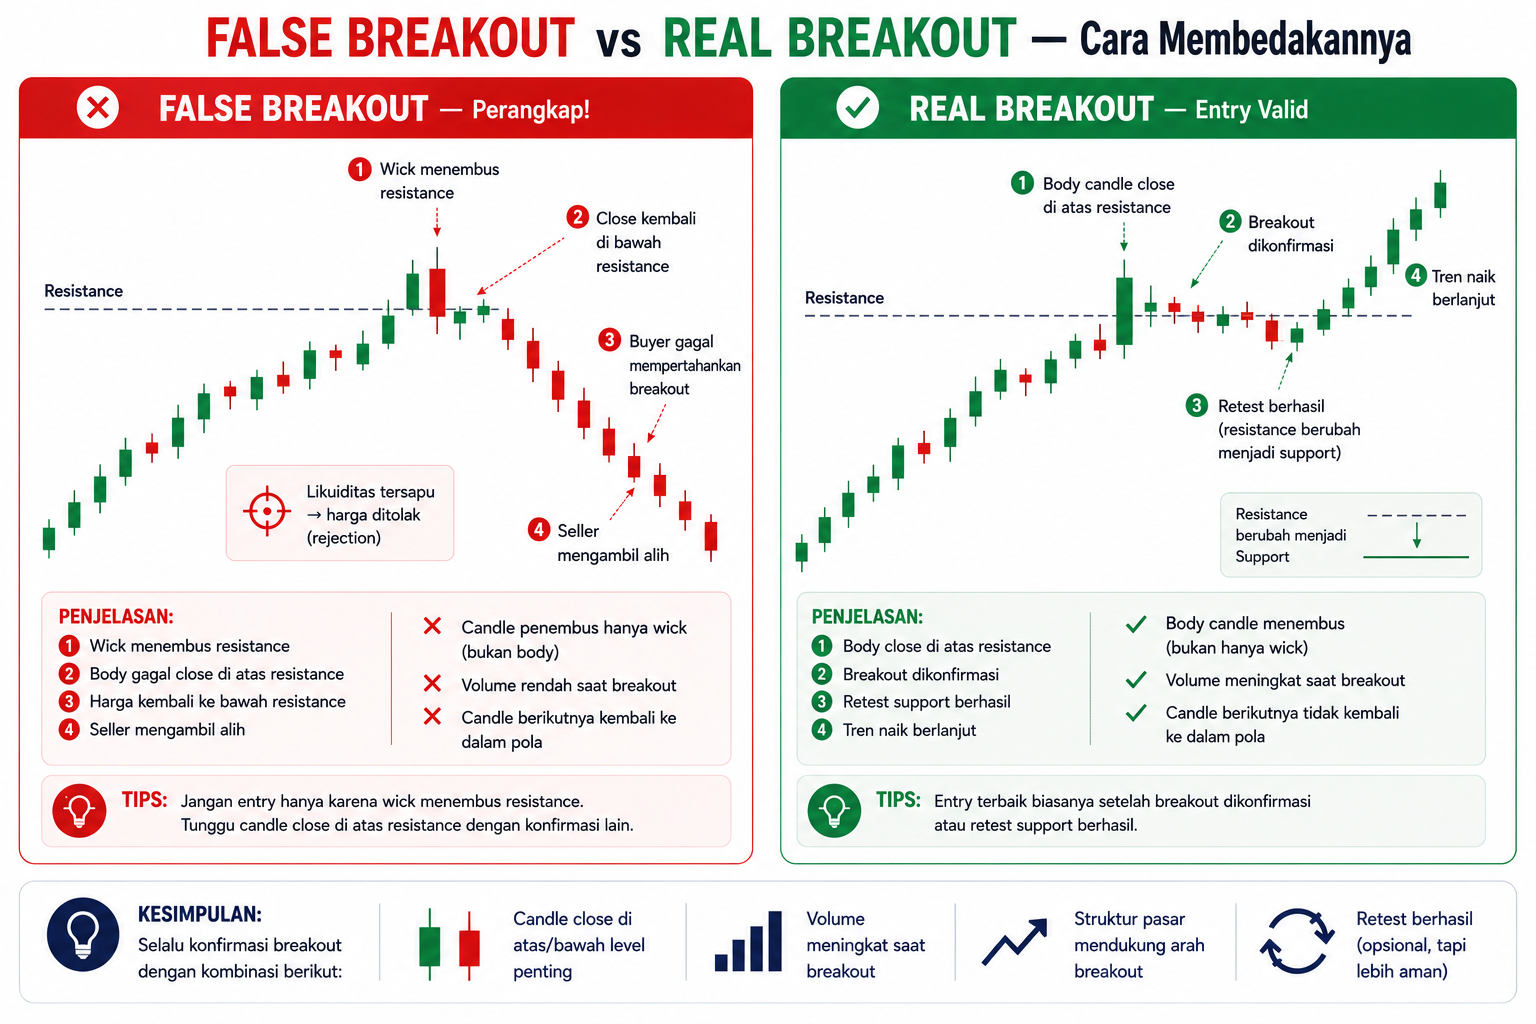
False breakouts are the biggest enemy of pattern traders. Price briefly pokes through the pattern line, lures traders in, then moves back inside the pattern and triggers a stop loss. There are reliable ways to filter these out:
Left: A false breakout, the wick pierces resistance but the body stays inside the pattern, followed by a reversal. Right: A real breakout, the candle body closes above resistance and the next candle does not return inside the pattern. The key is to focus on the body, not the wick.
Valid Breakout Checklist: 5 Points to Confirm Before Entry
✓
The candle body (not the wick) closes outside the pattern boundary
The candle's close must cross beyond the pattern line. A wick that pokes through while the body stays inside is a likely false breakout and should be ignored.
✓
Volume increases as the breakout occurs
In forex, volume cannot be measured directly, but a narrowing spread and smooth, non-choppy candle movement indicate high participation.
✓
A retrace confirmation, or the next candle does not move back inside the pattern
A valid breakout is often followed by a small retrace back to the breakout level (a pullback), then continuation. Price that immediately moves back inside the pattern is a warning sign.
✓
The prior trend context supports the breakout direction
An upward Ascending Triangle breakout during a downtrend is riskier than the same breakout during an uptrend. Always check the daily trend before entering on the 4-hour or 1-hour chart.
✓
A minimum 1:2 risk-to-reward ratio is available between entry and target
If the target (flagpole) is too close to the stop loss, skip the setup. The target should offer at least a 1:2 risk-to-reward ratio for the setup to be worthwhile.
← Scroll to see all points →
Part 7
Reference Table of All Patterns
A summary of all 9 continuation patterns in one table you can use as a reference while trading
← Scroll to see →
| Pattern |
Prior Trend |
Breakout Direction |
Entry Timing |
Target (TP) |
Reliability |
| Ascending Triangle |
Uptrend |
Bullish (upward) |
Close above the flat resistance line |
Breakout + triangle height |
High |
| Descending Triangle |
Downtrend |
Bearish (downward) |
Close below the flat support line |
Breakout − triangle height |
High |
| Symmetrical Triangle |
Either |
Follows prior trend |
Decisive close beyond the line + confirmation |
Breakout ± triangle height |
Medium |
| Bull Flag |
Strong uptrend |
Bullish (upward) |
Close above the upper channel line |
Breakout + pole length |
Very High |
| Bear Flag |
Strong downtrend |
Bearish (downward) |
Close below the lower channel line |
Breakout − pole length |
Very High |
| Bull Pennant |
Strong uptrend |
Bullish (upward) |
Close above the pennant apex |
Breakout + pole length |
High |
| Bear Pennant |
Strong downtrend |
Bearish (downward) |
Close below the pennant apex |
Breakout − pole length |
High |
| Rising Wedge |
Uptrend/Downtrend |
Bearish (downward) |
Close below the wedge support |
Breakout − initial wedge height |
Medium-High |
| Falling Wedge |
Downtrend/Uptrend |
Bullish (upward) |
Close above the wedge resistance |
Breakout + initial wedge height |
Medium-High |
"Following a trend is an easy job that looks hard. What makes it hard is impatience: entering too early before the pattern completes, or exiting too soon before the target is reached. A valid continuation pattern only requires two correct decisions: wait for breakout confirmation, and trust the target you already calculated."
Followme Academy · Intermediate Chart Patterns
1
A continuation pattern is a consolidation pattern that forms while a trend takes a "break" before continuing in the same direction. Unlike reversal patterns, traders do not need to guess a reversal. They simply wait for the trend to resume and join it.
2
Triangles come in three variations: Ascending (bullish, flat resistance), Descending (bearish, flat support), and Symmetrical (neutral, follows the prior trend). The key to identifying them is which line is flat and which line is sloped.
3
Flags and pennants are the most reliable patterns for swing traders. Both require a strong prior pole (a sharp move), followed by a brief consolidation (a channel for a flag, a small triangle for a pennant), then a breakout in the direction of the pole. The target is calculated by measuring the length of the pole.
4
A wedge is a two-sided pattern: a Rising Wedge is usually bearish (even if it appears within an uptrend), and a Falling Wedge is usually bullish (even if it appears within a downtrend). Both form because momentum is weakening behind the price move.
5
To calculate the target using the flagpole method: measure the pole length in pips, then add it (bullish) or subtract it (bearish) from the breakout point. This gives an objective take-profit level based on historical momentum, not a guess.
6
To filter false breakouts: the body (not the wick) must cross the pattern line, the next candle should not move back inside the pattern, and the breakout direction should align with the trend on a higher timeframe. If two of these three conditions are not met, consider skipping the trade.
Frequently Asked Questions
1 How long does a continuation pattern typically take to form before breaking out?+
It depends on the timeframe. On the 4-hour chart, flags and pennants typically complete within 5 to 20 candles (3 to 10 days). Triangles typically take longer, 15 to 40 candles (1 to 3 weeks), to produce enough touches on the pattern lines. On the daily chart, all of these patterns take longer to play out (several weeks to months). A general rule: if a pattern has run more than three-quarters of the way through the pole's length without breaking out, the probability of a valid breakout drops significantly.
2 Does the Flagpole target always have to be reached in full, or can profit be taken partially?+
The flagpole target is a minimum, momentum-based target. In a strong trend, price often goes beyond it. A commonly recommended approach is to close 50% of the position at 50% of the target (to lock in profit), move the stop loss to breakeven, and let the remainder run toward the full target or beyond using a trailing stop. This can help optimize the risk-to-reward ratio without leaving profit on the table. As with any strategy, this is not guaranteed to work on every trade.
3 How can I use these patterns to evaluate a copy-trading provider's chart history on Followme?+
Open the provider's trade history on the Followme chart and look at their entry points. A provider who consistently enters right at the breakout of a valid pattern (rather than mid-trend or before confirmation) shows a good understanding of chart patterns. In contrast, entries that look random, or that occur while the pattern is still forming rather than at the breakout, are a sign of a less structured system. Flag and pennant patterns are usually the easiest to spot visually in a provider's trade history. Keep in mind that copy trading carries the full risk of the underlying trades, and a provider's past performance does not guarantee future results.